Berkshire Hathaway 2003 Annual Report Download - page 51
Download and view the complete annual report
Please find page 51 of the 2003 Berkshire Hathaway annual report below. You can navigate through the pages in the report by either clicking on the pages listed below, or by using the keyword search tool below to find specific information within the annual report.-
 1
1 -
2
-
3
-
4
-
5
-
6
-
7
-
8
-
9
-
10
-
11
-
12
-
13
-
14
-
15
-
16
-
17
-
18
-
19
-
20
-
21
-
22
-
23
-
24
-
25
-
26
-
27
-
28
-
29
-
30
-
31
-
32
-
33
-
34
-
35
-
36
-
37
-
38
-
39
-
40
-
 41
41 -
 42
42 -
 43
43 -
 44
44 -
 45
45 -
 46
46 -
 47
47 -
 48
48 -
 49
49 -
 50
50 -
 51
51 -
 52
52 -
 53
53 -
 54
54 -
 55
55 -
 56
56 -
 57
57 -
 58
58 -
 59
59 -
 60
60 -
 61
61 -
62
-
63
-
64
-
65
-
66
-
67
-
68
-
69
-
70
-
71
-
72
-
73
-
74
-
75
-
76
-
77
-
78
 |
 |

50
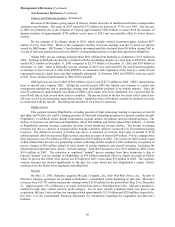
Notes to Consolidated Financial Statements (Continued)
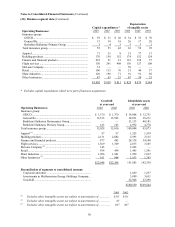
(20) Business segment data (Continued)
Depreciation
Capital expenditures * of tangible assets
Operating Businesses: 2003 2002 2001 2003 2002 2001
Insurance group:
GEICO............................................................................ $ 39 $ 31 $ 20 $ 34 $ 32 $ 70
General Re...................................................................... 13 18 19 26 17 20
Berkshire Hathaway Primary Group .............................. 3 4 3 3 3 2
Total insurance group........................................................ 55 53 42 63 52 92
Apparel.............................................................................. 71 51 851 37 13
Building products.............................................................. 170 158 152 174 152 124
Finance and financial products.......................................... 232 51 21 161 150 57
Flight services ................................................................... 150 241 408 136 127 108
McLane Company............................................................. 51 — — 59 — —
Retail ................................................................................. 106 113 76 51 40 37
Shaw Industries ................................................................. 120 196 71 91 91 88
Other businesses................................................................ 47 65 33 43 30 25
$1,002 $ 928 $ 811 $ 829 $ 679 $ 544
* Excludes capital expenditures which were part of business acquisitions.
Goodwill Identifiable assets
at year-end at year-end
Operating Businesses: 2003 2002 2003 2002
Insurance group:
GEICO.................................................................................. $ 1,370 $ 1,370 $ 14,088 $ 12,751
General Re............................................................................ 13,515 13,503 38,831 38,271
Berkshire Hathaway Reinsurance Group.............................. — — 51,133 40,181
Berkshire Hathaway Primary Group..................................... 143 143 4,952 4,770
Total insurance group.............................................................. 15,028 15,016 109,004 95,973
Apparel (1) ................................................................................ 57 57 1,523 1,539
Building products .................................................................... 2,131 2,082 2,593 2,515
Finance and financial products ................................................ 877 495 28,338 34,148
Flight services.......................................................................... 1,369 1,369 2,875 3,105
McLane Company (2) ............................................................... 145 —2,243 —
Retail ....................................................................................... 434 434 1,495 1,341
Shaw Industries ....................................................................... 1,996 1,941 1,999 1,932
Other businesses (3) .................................................................. 911 904 1,813 1,785
$22,948 $22,298 151,883 142,338
Reconciliation of segments to consolidated amount:
Corporate and other ............................................................. 1,829 1,257
Investments in MidAmerican Energy Holdings Company .. 3,899 3,651
Goodwill .............................................................................. 22,948 22,298
$180,559 $169,544
2003 2002
(1) Excludes other intangible assets not subject to amortization of................ $311 $311
(2) Excludes other intangible assets not subject to amortization of................ 65 —
(3) Excludes other intangible assets not subject to amortization of................ 697 697