Berkshire Hathaway 2003 Annual Report Download - page 53
Download and view the complete annual report
Please find page 53 of the 2003 Berkshire Hathaway annual report below. You can navigate through the pages in the report by either clicking on the pages listed below, or by using the keyword search tool below to find specific information within the annual report.-
 1
1 -
2
-
3
-
4
-
5
-
6
-
7
-
8
-
9
-
10
-
11
-
12
-
13
-
14
-
15
-
16
-
17
-
18
-
19
-
20
-
21
-
22
-
23
-
24
-
25
-
26
-
27
-
28
-
29
-
30
-
31
-
32
-
33
-
34
-
35
-
36
-
37
-
38
-
39
-
40
-
41
-
42
-
 43
43 -
 44
44 -
 45
45 -
 46
46 -
 47
47 -
 48
48 -
 49
49 -
 50
50 -
 51
51 -
 52
52 -
 53
53 -
 54
54 -
 55
55 -
 56
56 -
 57
57 -
 58
58 -
 59
59 -
 60
60 -
 61
61 -
 62
62 -
 63
63 -
64
-
65
-
66
-
67
-
68
-
69
-
70
-
71
-
72
-
73
-
74
-
75
-
76
-
77
-
78
 |
 |

52
BERKSHIRE HATHAWAY INC.
and Subsidiaries
Management’s Discussion and Analysis of
Financial Condition and Results of Operations
Results of Operations
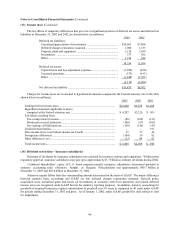
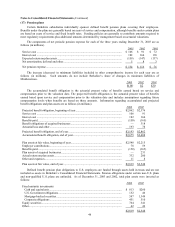
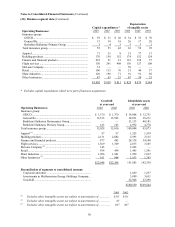
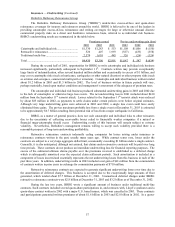
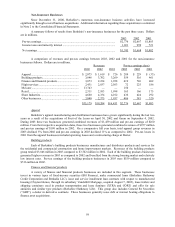
Net earnings for each of the past three years are disaggregated in the table that follows. Amounts are after
deducting income taxes and minority interest. Dollars are in millions.
2003 2002 2001
Insurance – underwriting ................................................................................. $1,114 $ (284) $(2,654)
Insurance – investment income ........................................................................ 2,276 2,096 1,968
Non-insurance businesses ................................................................................ 1,745 1,668 1,082
Equity in earnings of MidAmerican Energy Holdings Company .................... 429 359 134
Interest expense................................................................................................ (59) (55) (60)
Purchase-accounting adjustments .................................................................... (104) (65) (603)
Other ................................................................................................................ 21 1 5
Earnings before realized investment gains ........................................... 5,422 3,720 (128)
Realized investment gains................................................................................ 2,729 566 923
Net earnings.......................................................................................... $8,151 $ 4,286 $ 795
The business segment data (Note 20 to Consolidated Financial Statements) should be read in conjunction
with this discussion.
Insurance — Underwriting
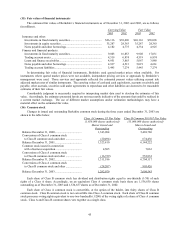
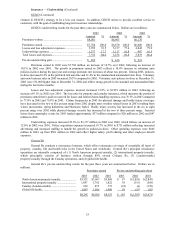
A summary follows of underwriting results from Berkshire’ s insurance businesses for the past three years.
Dollars are in millions.
2003 2002 2001
Underwriting gain (loss) attributable to:
GEICO........................................................................................................ $ 452 $ 416 $ 221
General Re.................................................................................................. 145 (1,393) (3,671)
Berkshire Hathaway Reinsurance Group ................................................... 1,047 547 (634)
Berkshire Hathaway Primary Group .......................................................... 74 32 30
Underwriting gain (loss) — pre-tax ................................................................. 1,718 (398) (4,054)
Income taxes and minority interest ................................................................. 604 (114) (1,400)
Net underwriting gain (loss) ................................................................. $ 1,114 $ (284) $(2,654)
Berkshire engages in both primary insurance and reinsurance of property and casualty risks. Through
General Re, Berkshire also reinsures life and health risks. In primary insurance activities, Berkshire subsidiaries
assume defined portions of the risks of loss from persons or organizations that are directly subject to the risks. In
reinsurance activities, Berkshire subsidiaries assume defined portions of similar or dissimilar risks that other
insurers or reinsurers have subjected themselves to in their own insuring activities. Berkshire’ s principal insurance
businesses are: (1) GEICO, the fifth largest auto insurer in the U.S., (2) General Re, one of the four largest
reinsurers in the world, (3) Berkshire Hathaway Reinsurance Group (“BHRG”) and (4) Berkshire Hathaway
Primary Group. Berkshire’ s management views insurance businesses as possessing two distinct operations –
underwriting and investing. Accordingly, Berkshire evaluates performance of underwriting operations without any
allocation of investment income.
A significant marketing strategy followed by all these businesses is the maintenance of extraordinary
capital strength. Statutory surplus of Berkshire’ s insurance businesses totaled approximately $40.7 billion at
December 31, 2003. This superior capital strength creates opportunities, especially with respect to reinsurance
activities, to negotiate and enter into insurance and reinsurance contracts specially designed to meet unique needs of
sophisticated insurance and reinsurance buyers. Additional information regarding Berkshire’ s insurance and
reinsurance operations follows.
GEICO
GEICO provides primarily private passenger automobile coverages to insureds in 48 states and the District
of Columbia. GEICO policies are marketed mainly by direct response methods in which customers apply for
coverage directly to the company over the telephone, through the mail or via the Internet. This is a significant