Berkshire Hathaway 2003 Annual Report Download - page 60
Download and view the complete annual report
Please find page 60 of the 2003 Berkshire Hathaway annual report below. You can navigate through the pages in the report by either clicking on the pages listed below, or by using the keyword search tool below to find specific information within the annual report.-
 1
1 -
2
-
3
-
4
-
5
-
6
-
7
-
8
-
9
-
10
-
11
-
12
-
13
-
14
-
15
-
16
-
17
-
18
-
19
-
20
-
21
-
22
-
23
-
24
-
25
-
26
-
27
-
28
-
29
-
30
-
31
-
32
-
33
-
34
-
35
-
36
-
37
-
38
-
39
-
40
-
41
-
42
-
43
-
44
-
45
-
46
-
47
-
48
-
49
-
 50
50 -
 51
51 -
 52
52 -
 53
53 -
 54
54 -
 55
55 -
 56
56 -
 57
57 -
 58
58 -
 59
59 -
 60
60 -
 61
61 -
 62
62 -
 63
63 -
 64
64 -
 65
65 -
 66
66 -
 67
67 -
 68
68 -
 69
69 -
 70
70 -
71
-
72
-
73
-
74
-
75
-
76
-
77
-
78
 |
 |

59
Non-Insurance Businesses
Since December 31, 2000, Berkshire’ s numerous non-insurance business activities have increased
significantly through several business acquisitions. Additional information regarding these acquisitions is contained
in Note 2 to the Consolidated Financial Statements.
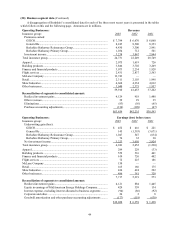
A summary follows of results from Berkshire’ s non-insurance businesses for the past three years. Dollars
are in millions.
2003 2002 2001
Pre-tax earnings....................................................................................................... $2,776 $2,667 $1,803
Income taxes and minority interest ......................................................................... 1,031 999 721
Net earnings ............................................................................................................ $1,745 $1,668 $1,082
A comparison of revenues and pre-tax earnings between 2003, 2002 and 2001 for the non-insurance
businesses follows. Dollars are in millions.
Revenues Pre-tax earnings (loss)
2003 2002 2001 2003 2002 2001
Apparel.................................................................. $ 2,075 $ 1,619 $ 726 $ 289 $ 229 $ (33)
Building products.................................................. 3,846 3,702 3,269 559 516 461
Finance and financial products.............................. 3,073 2,234 1,928 619 726 402
Flight services ....................................................... 2,431 2,837 2,563 72 225 186
McLane ................................................................. 13,743 — — 150 — —
Retail ..................................................................... 2,311 2,103 1,998 165 166 175
Shaw Industries..................................................... 4,660 4,334 4,012 436 424 292
Other businesses.................................................... 3,040 2,375 1,957 486 381 320
$35,179 $19,204 $16,453 $2,776 $2,667 $1,803
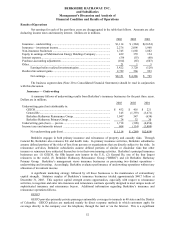
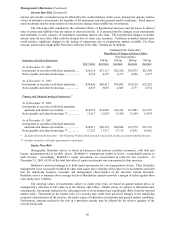
Apparel
Berkshire’ s apparel manufacturing and distribution businesses have grown significantly during the last two
years as a result of the acquisitions of Fruit of the Loom on April 30, 2002 and Garan on September 4, 2002.
During 2003 these two businesses generated combined revenues of $1,459 million and pre-tax earnings of $260
million. From their respective acquisition dates, these two businesses generated combined revenues of $957 million
and pre-tax earnings of $190 million in 2002. On a comparative full year basis, total apparel group revenues in
2003 declined 5% from 2002 and pre-tax earnings in 2003 declined 11% as compared to 2002. Pre-tax losses in
2001 from the apparel businesses included operating losses and a restructuring charge at Dexter.
Building products
Each of Berkshire’ s building products businesses manufactures and distributes products and services for
the residential and commercial construction and home improvement markets. Revenues of the building products
group totaled $3,846 million in 2003 compared to $3,702 million in 2002. Each of the building products businesses
generated higher revenues in 2003 as compared to 2002 and benefited from the strong housing market and relatively
low interest rates. Pre-tax earnings of the building products businesses in 2003 were $559 million compared to
$516 million in 2002.
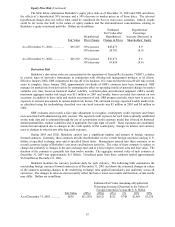
Finance and financial products
A variety of finance and financial products businesses are included in this segment. These businesses
invest in various types of fixed-income securities (BH Finance), make commercial loans (Berkshire Hathaway
Credit Corporation and Berkadia LLC), issue and service installment loan contracts with respect to manufactured
housing (Clayton Homes, through its subsidiary Vanderbilt Mortgage, acquired August 7, 2003), lease trailers and
shipping containers used in product transportation and lease furniture (XTRA and CORT) and offer for sale
annuities and similar type products (Berkshire Hathaway Life). This group also includes General Re Securities
(“GRS”), a dealer in derivative contracts. These businesses generally issue debt or interest bearing obligations to
finance asset acquisitions.