Berkshire Hathaway 2003 Annual Report Download - page 50
Download and view the complete annual report
Please find page 50 of the 2003 Berkshire Hathaway annual report below. You can navigate through the pages in the report by either clicking on the pages listed below, or by using the keyword search tool below to find specific information within the annual report.-
 1
1 -
2
-
3
-
4
-
5
-
6
-
7
-
8
-
9
-
10
-
11
-
12
-
13
-
14
-
15
-
16
-
17
-
18
-
19
-
20
-
21
-
22
-
23
-
24
-
25
-
26
-
27
-
28
-
29
-
30
-
31
-
32
-
33
-
34
-
35
-
36
-
37
-
38
-
39
-
 40
40 -
 41
41 -
 42
42 -
 43
43 -
 44
44 -
 45
45 -
 46
46 -
 47
47 -
 48
48 -
 49
49 -
 50
50 -
 51
51 -
 52
52 -
 53
53 -
 54
54 -
 55
55 -
 56
56 -
 57
57 -
 58
58 -
 59
59 -
 60
60 -
61
-
62
-
63
-
64
-
65
-
66
-
67
-
68
-
69
-
70
-
71
-
72
-
73
-
74
-
75
-
76
-
77
-
78
 |
 |

49
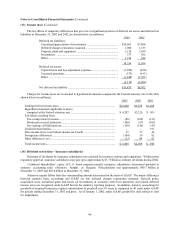
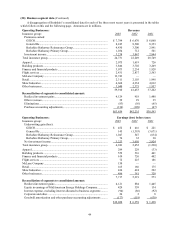
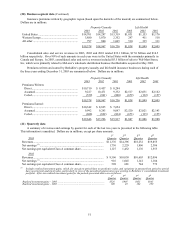
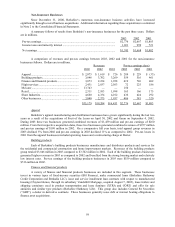
(20) Business segment data (Continued)
A disaggregation of Berkshire’ s consolidated data for each of the three most recent years is presented in the tables
which follow on this and the following page. Amounts are in millions.
Operating Businesses: Revenues
Insurance group: 2003 2002 2001
Premiums earned:
GEICO.................................................................................................... $ 7,784 $ 6,670 $ 6,060
General Re.............................................................................................. 8,245 8,500 8,353
Berkshire Hathaway Reinsurance Group................................................ 4,430 3,300 2,991
Berkshire Hathaway Primary Group....................................................... 1,034 712 501
Investment income..................................................................................... 3,238 3,067 2,844
Total insurance group................................................................................... 24,731 22,249 20,749
Apparel......................................................................................................... 2,075 1,619 726
Building products ......................................................................................... 3,846 3,702 3,269
Finance and financial products..................................................................... 3,073 2,234 1,928
Flight services .............................................................................................. 2,431 2,837 2,563
McLane Company........................................................................................ 13,743 — —
Retail ............................................................................................................ 2,311 2,103 1,998
Shaw Industries ............................................................................................ 4,660 4,334 4,012
Other businesses........................................................................................... 3,040 2,375 1,957
59,910 41,453 37,202
Reconciliation of segments to consolidated amount:
Realized investment gains ......................................................................... 4,129 918 1,488
Other revenues........................................................................................... 39 29 35
Eliminations............................................................................................... (83) (56) (65)
Purchase-accounting adjustments.............................................................. (136) (109) (67)
$63,859 $42,235 $38,593
Operating Businesses: Earnings (loss) before taxes
Insurance group: 2003 2002 2001
Underwriting gain (loss):
GEICO.................................................................................................... $ 452 $ 416 $ 221
General Re.............................................................................................. 145 (1,393) (3,671)
Berkshire Hathaway Reinsurance Group................................................ 1,047 547 (634)
Berkshire Hathaway Primary Group....................................................... 74 32 30
Net investment income.............................................................................. 3,223 3,050 2,824
Total insurance group................................................................................... 4,941 2,652 (1,230)
Apparel......................................................................................................... 289 229 (33)
Building products ......................................................................................... 559 516 461
Finance and financial products..................................................................... 619 726 402
Flight services .............................................................................................. 72 225 186
McLane Company........................................................................................ 150 — —
Retail ............................................................................................................ 165 166 175
Shaw Industries ............................................................................................ 436 424 292
Other businesses........................................................................................... 486 381 320
7,717 5,319 573
Reconciliation of segments to consolidated amount:
Realized investment gains ......................................................................... 4,121 884 1,445
Equity in earnings of MidAmerican Energy Holdings Company.............. 429 359 134
Interest expense, excluding interest allocated to business segments ......... (94) (86) (92)
Corporate and other................................................................................... 24 2 8
Goodwill amortization and other purchase-accounting adjustments ......... (177) (119) (630)
$12,020 $ 6,359 $ 1,438