Berkshire Hathaway 2003 Annual Report Download - page 5
Download and view the complete annual report
Please find page 5 of the 2003 Berkshire Hathaway annual report below. You can navigate through the pages in the report by either clicking on the pages listed below, or by using the keyword search tool below to find specific information within the annual report.-
 1
1 -
 2
2 -
 3
3 -
 4
4 -
 5
5 -
 6
6 -
 7
7 -
 8
8 -
 9
9 -
 10
10 -
 11
11 -
 12
12 -
 13
13 -
 14
14 -
 15
15 -
 16
16 -
17
-
18
-
19
-
20
-
21
-
22
-
23
-
24
-
25
-
26
-
27
-
28
-
29
-
30
-
31
-
32
-
33
-
34
-
35
-
36
-
37
-
38
-
39
-
40
-
41
-
42
-
43
-
44
-
45
-
46
-
47
-
48
-
49
-
50
-
51
-
52
-
53
-
54
-
55
-
56
-
57
-
58
-
59
-
60
-
61
-
62
-
63
-
64
-
65
-
66
-
67
-
68
-
69
-
70
-
71
-
72
-
73
-
74
-
75
-
76
-
77
-
78
 |
 |

4
Operating Earnings
When valuations are similar, we strongly prefer owning businesses to owning stocks. During
most of our years of operation, however, stocks were much the cheaper choice. We therefore sharply tilted
our asset allocation in those years toward equities, as illustrated by the percentages cited earlier.
In recent years, however, we’ ve found it hard to find significantly undervalued stocks, a difficulty
greatly accentuated by the mushrooming of the funds we must deploy. Today, the number of stocks that
can be purchased in large enough quantities to move the performance needle at Berkshire is a small fraction
of the number that existed a decade ago. (Investment managers often profit far more from piling up assets
than from handling those assets well. So when one tells you that increased funds won’ t hurt his investment
performance, step back: His nose is about to grow.)
The shortage of attractively-priced stocks in which we can put large sums doesn’ t bother us,
providing we can find companies to purchase that (1) have favorable and enduring economic charac-
teristics; (2) are run by talented and honest managers and (3) are available at a sensible price. We have
purchased a number of such businesses in recent years, though not enough to fully employ the gusher of
cash that has come our way. In buying businesses, I’ ve made some terrible mistakes, both of commission
and omission. Overall, however, our acquisitions have led to decent gains in per-share earnings.
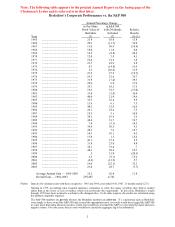
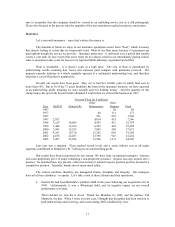
Below is a table that quantifies that point. But first we need to warn you that growth-rate
presentations can be significantly distorted by a calculated selection of either initial or terminal dates. For
example, if earnings are tiny in a beginning year, a long-term performance that was only mediocre can be
made to appear sensational. That kind of distortion can come about because the company at issue was
minuscule in the base year – which means that only a handful of insiders actually benefited from the touted
performance – or because a larger company was then operating at just above breakeven. Picking a terminal
year that is particularly buoyant will also favorably bias a calculation of growth.
The Berkshire Hathaway that present management assumed control of in 1965 had long been
sizable. But in 1964, it earned only $175,586 or 15 cents per share, so close to breakeven that any
calculation of earnings growth from that base would be meaningless. At the time, however, even those
meager earnings looked good: Over the decade following the 1955 merger of Berkshire Fine Spinning
Associates and Hathaway Manufacturing, the combined operation had lost $10.1 million and many
thousands of employees had been let go. It was not a marriage made in heaven.
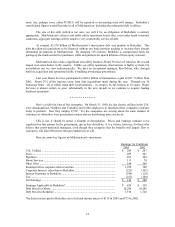
Against this background, we give you a picture of Berkshire’ s earnings growth that begins in
1968, but also includes subsequent base years spaced five years apart. A series of calculations is presented
so that you can decide for yourself which period is most meaningful. I’ ve started with 1968 because it was
the first full year we operated National Indemnity, the initial acquisition we made as we began to expand
Berkshire’ s business.
I don’ t believe that using 2003 as the terminal year distorts our calculations. It was a terrific year
for our insurance business, but the big boost that gave to earnings was largely offset by the pathetically low
interest rates we earned on our large holdings of cash equivalents (a condition that will not last). All
figures shown below, it should be noted, exclude capital gains.
O
p
eratin
g
Earnin
g
s O
p
eratin
g
Earnin
g
sSubse
q
uent Com
p
ounded
Yea
r
in $ millions Per Share in $ Growth Rate o
f
Per-Share Earnin
g
s
1964 .2 .15
N
ot meanin
g
ful
(
1964-2003
)
1968 2.7 2.69 22.8%
(
1968-2003
)
1973 11.9 12.18 20.8%
(
1973-2003
)
1978 30.0 29.15 21.1%
(
1978-2003
)
1983 48.6 45.60 24.3%
(
1983-2003
)
1988 313.4 273.37 18.6%
(
1988-2003
)
1993 477.8 413.19 23.9%
(
1993-2003
)
1998 1
,
277.0 1
,
020.49 28.2%
(
1998-2003
)
2003 5
,
422.0 3
,
531.32