Berkshire Hathaway 2003 Annual Report Download - page 21
Download and view the complete annual report
Please find page 21 of the 2003 Berkshire Hathaway annual report below. You can navigate through the pages in the report by either clicking on the pages listed below, or by using the keyword search tool below to find specific information within the annual report.-
 1
1 -
2
-
3
-
4
-
5
-
6
-
7
-
8
-
9
-
10
-
 11
11 -
 12
12 -
 13
13 -
 14
14 -
 15
15 -
 16
16 -
 17
17 -
 18
18 -
 19
19 -
 20
20 -
 21
21 -
 22
22 -
 23
23 -
 24
24 -
 25
25 -
 26
26 -
 27
27 -
 28
28 -
 29
29 -
 30
30 -
 31
31 -
32
-
33
-
34
-
35
-
36
-
37
-
38
-
39
-
40
-
41
-
42
-
43
-
44
-
45
-
46
-
47
-
48
-
49
-
50
-
51
-
52
-
53
-
54
-
55
-
56
-
57
-
58
-
59
-
60
-
61
-
62
-
63
-
64
-
65
-
66
-
67
-
68
-
69
-
70
-
71
-
72
-
73
-
74
-
75
-
76
-
77
-
78
 |
 |

20
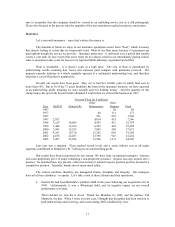
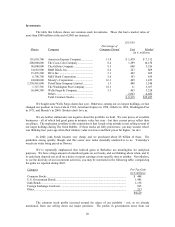
Investments
The table that follows shows our common stock investments. Those that had a market value of
more than $500 million at the end of 2003 are itemized.
12/31/03
Shares Company Percentage of
Company Owned Cost Market
(in $ millions)
151,610,700 American Express Company ................ 11.8 $ 1,470 $ 7,312
200,000,000 The Coca-Cola Company ..................... 8.2 1,299 10,150
96,000,000 The Gillette Company .......................... 9.5 600 3,526
14,610,900 H&R Block, Inc.................................... 8.2 227 809
15,476,500 HCA Inc. .............................................. 3.1 492 665
6,708,760 M&T Bank Corporation ....................... 5.6 103 659
24,000,000 Moody’ s Corporation ........................... 16.1 499 1,453
2,338,961,000 PetroChina Company Limited.............. 1.3 488 1,340
1,727,765 The Washington Post Company ........... 18.1 11 1,367
56,448,380 Wells Fargo & Company...................... 3.3 463 3,324
Others ................................................... 2,863 4,682
Total Common Stocks .......................... $ 8,515 $35,287
We bought some Wells Fargo shares last year. Otherwise, among our six largest holdings, we last
changed our position in Coca-Cola in 1994, American Express in 1998, Gillette in 1989, Washington Post
in 1973, and Moody’ s in 2000. Brokers don’ t love us.
We are neither enthusiastic nor negative about the portfolio we hold. We own pieces of excellent
businesses – all of which had good gains in intrinsic value last year – but their current prices reflect their
excellence. The unpleasant corollary to this conclusion is that I made a big mistake in not selling several of
our larger holdings during The Great Bubble. If these stocks are fully priced now, you may wonder what I
was thinking four years ago when their intrinsic value was lower and their prices far higher. So do I.
In 2002, junk bonds became very cheap, and we purchased about $8 billion of these. The
pendulum swung quickly though, and this sector now looks decidedly unattractive to us. Yesterday’ s
weeds are today being priced as flowers.
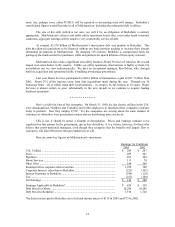
We’ ve repeatedly emphasized that realized gains at Berkshire are meaningless for analytical
purposes. We have a huge amount of unrealized gains on our books, and our thinking about when, and if,
to cash them depends not at all on a desire to report earnings at one specific time or another. Nevertheless,
to see the diversity of our investment activities, you may be interested in the following table, categorizing
the gains we reported during 2003:
Category Pre-Tax Gain
(in $ million)
Common Stocks .............................................................................................................. $ 448
U.S. Government Bonds.................................................................................................. 1,485
Junk Bonds......................................................................................................................1,138
Foreign Exchange Contracts ........................................................................................... 825
Other................................................................................................................................ 233
$4,129
The common stock profits occurred around the edges of our portfolio – not, as we already
mentioned, from our selling down our major positions. The profits in governments arose from our