Berkshire Hathaway 2003 Annual Report Download - page 19
Download and view the complete annual report
Please find page 19 of the 2003 Berkshire Hathaway annual report below. You can navigate through the pages in the report by either clicking on the pages listed below, or by using the keyword search tool below to find specific information within the annual report.-
 1
1 -
2
-
3
-
4
-
5
-
6
-
7
-
8
-
 9
9 -
 10
10 -
 11
11 -
 12
12 -
 13
13 -
 14
14 -
 15
15 -
 16
16 -
 17
17 -
 18
18 -
 19
19 -
 20
20 -
 21
21 -
 22
22 -
 23
23 -
 24
24 -
 25
25 -
 26
26 -
 27
27 -
 28
28 -
 29
29 -
30
-
31
-
32
-
33
-
34
-
35
-
36
-
37
-
38
-
39
-
40
-
41
-
42
-
43
-
44
-
45
-
46
-
47
-
48
-
49
-
50
-
51
-
52
-
53
-
54
-
55
-
56
-
57
-
58
-
59
-
60
-
61
-
62
-
63
-
64
-
65
-
66
-
67
-
68
-
69
-
70
-
71
-
72
-
73
-
74
-
75
-
76
-
77
-
78
 |
 |

18
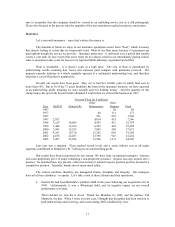
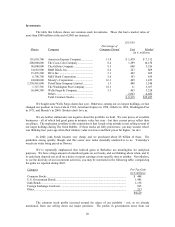
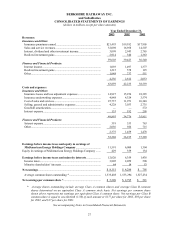
Earnings Statement (in $ millions) 2003 2002
Revenues ............................................................................................................ $32,106 $16,970
Operating expenses (including depreciation of $605 in 2003
and $477 in 2002)........................................................................................ 29,885 14,921
Interest expense (net).......................................................................................... 64 108
Pre-tax income.................................................................................................... 2,157 1,941
Income taxes....................................................................................................... 813 743
Net income ......................................................................................................... $ 1,344 $ 1,198
This eclectic group, which sells products ranging from Dilly Bars to B-737s, earned a hefty 20.7%
on average tangible net worth last year. However, we purchased these businesses at substantial premiums
to net worth – that fact is reflected in the goodwill item shown on the balance sheet – and that reduces the
earnings on our average carrying value to 9.2%.
Here are the pre-tax earnings for the larger categories or units.
Pre-Tax Earnings
(in $ millions)
2003 2002
Building Products ................................................................................................... $ 559 $ 516
Shaw Industries ...................................................................................................... 436 424
Apparel ................................................................................................................... 289 229
Retail Operations.................................................................................................... 224 219
Flight Services........................................................................................................ 72 225
McLane *................................................................................................................ 150 —
Other businesses..................................................................................................... 427 328
$2,157 $1,941
* From date of acquisition, May 23, 2003.
• Three of our building-materials businesses – Acme Brick, Benjamin Moore and MiTek – had record
operating earnings last year. And earnings at Johns Manville, the fourth, were trending upward at
yearend. Collectively, these companies earned 21.0% on tangible net worth.
• Shaw Industries, the world’ s largest manufacturer of broadloom carpet, also had a record year. Led by
Bob Shaw, who built this huge enterprise from a standing start, the company will likely set another
earnings record in 2004. In November, Shaw acquired various carpet operations from Dixie Group,
which should add about $240 million to sales this year, boosting Shaw’ s volume to nearly $5 billion.
• Within the apparel group, Fruit of the Loom is our largest operation. Fruit has three major assets: a
148-year-old universally-recognized brand, a low-cost manufacturing operation, and John Holland, its
CEO. In 2003, Fruit accounted for 42.3% of the men’ s and boys’ underwear that was sold by mass
marketers (Wal-Mart, Target, K-Mart, etc.) and increased its share of the women’ s and girls’ business
in that channel to 13.9%, up from 11.3% in 2002.
• In retailing, our furniture group earned $106 million pre-tax, our jewelers $59 million and See’ s, which
is both a manufacturer and retailer, $59 million.
Both R.C. Willey and Nebraska Furniture Mart (“NFM”) opened hugely successful stores last year,
Willey in Las Vegas and NFM in Kansas City, Kansas. Indeed, we believe the Kansas City store is the
country’ s largest-volume home-furnishings store. (Our Omaha operation, while located on a single
plot of land, consists of three units.)