Berkshire Hathaway 2003 Annual Report Download - page 46
Download and view the complete annual report
Please find page 46 of the 2003 Berkshire Hathaway annual report below. You can navigate through the pages in the report by either clicking on the pages listed below, or by using the keyword search tool below to find specific information within the annual report.-
 1
1 -
2
-
3
-
4
-
5
-
6
-
7
-
8
-
9
-
10
-
11
-
12
-
13
-
14
-
15
-
16
-
17
-
18
-
19
-
20
-
21
-
22
-
23
-
24
-
25
-
26
-
27
-
28
-
29
-
30
-
31
-
32
-
33
-
34
-
35
-
 36
36 -
 37
37 -
 38
38 -
 39
39 -
 40
40 -
 41
41 -
 42
42 -
 43
43 -
 44
44 -
 45
45 -
 46
46 -
 47
47 -
 48
48 -
 49
49 -
 50
50 -
 51
51 -
 52
52 -
 53
53 -
 54
54 -
 55
55 -
 56
56 -
57
-
58
-
59
-
60
-
61
-
62
-
63
-
64
-
65
-
66
-
67
-
68
-
69
-
70
-
71
-
72
-
73
-
74
-
75
-
76
-
77
-
78
 |
 |

45
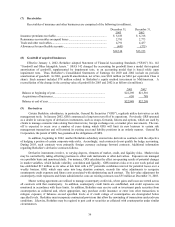
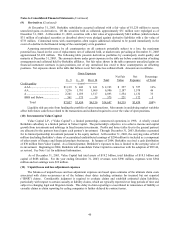
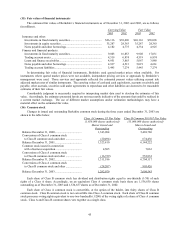
(15) Fair values of financial instruments
The estimated fair values of Berkshire’ s financial instruments as of December 31, 2003 and 2002, are as follows
(in millions). Carrying Value Fair Value
2003 2002 2003 2002
Insurance and other:
Investments in fixed maturity securities............................................ $26,116 $38,096 $26,116 $38,096
Investments in equity securities ........................................................ 35,287 28,363 35,287 28,363
Notes payable and other borrowings ................................................. 4,182 4,775 4,334 4,925
Finance and financial products:
Investments in fixed maturity securities............................................ 9,803 16,853 9,908 17,031
Trading account assets ...................................................................... 4,519 6,874 4,519 6,874
Loans and finance receivables........................................................... 4,951 3,863 5,067 3,988
Notes payable and other borrowings ................................................. 4,937 4,513 5,019 4,661
Trading account liabilities................................................................. 5,445 7,274 5,445 7,274
In determining fair value of financial instruments, Berkshire used quoted market prices when available. For
instruments where quoted market prices were not available, independent pricing services or appraisals by Berkshire’ s
management were used. Those services and appraisals reflected the estimated present values utilizing current risk
adjusted market rates of similar instruments. The carrying values of cash and cash equivalents, accounts receivable and
payable, other accruals, securities sold under agreements to repurchase and other liabilities are deemed to be reasonable
estimates of their fair values.
Considerable judgment is necessarily required in interpreting market data used to develop the estimates of fair
value. Accordingly, the estimates presented herein are not necessarily indicative of the amounts that could be realized in
a current market exchange. The use of different market assumptions and/or estimation methodologies may have a
material effect on the estimated fair value.
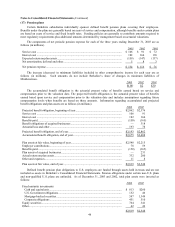
(16) Common stock
Changes in issued and outstanding Berkshire common stock during the three years ended December 31, 2003 are
shown in the table below. Class A Common, $5 Par Value Class B Common $0.1667 Par Value
(1,650,000 shares authorized) (55,000,000 shares authorized)
Shares Issued and Shares Issued and
Outstanding Outstanding
Balance December 31, 2000..................................... 1,343,904 5,469,786
Conversions of Class A common stock
to Class B common stock and other ...................... (20,494) 674,436
Balance December 31, 2001..................................... 1,323,410 6,144,222
Common stock issued in connection
with a business acquisition .................................... 4,505 7,063
Conversions of Class A common stock
to Class B common stock and other ...................... (16,729) 552,832
Balance December 31, 2002..................................... 1,311,186 6,704,117
Conversions of Class A common stock
to Class B common stock and other ...................... (28,207) 905,426
Balance December 31, 2003..................................... 1,282,979 7,609,543
Each share of Class B common stock has dividend and distribution rights equal to one-thirtieth (1/30) of such
rights of a Class A share. Accordingly, on an equivalent Class A common stock basis there are 1,536,630 shares
outstanding as of December 31, 2003 and 1,534,657 shares as of December 31, 2002.
Each share of Class A common stock is convertible, at the option of the holder, into thirty shares of Class B
common stock. Class B common stock is not convertible into Class A common stock. Each share of Class B common
stock possesses voting rights equivalent to one-two-hundredth (1/200) of the voting rights of a share of Class A common
stock. Class A and Class B common shares vote together as a single class.