Audi 2013 Annual Report Download - page 268
Download and view the complete annual report
Please find page 268 of the 2013 Audi annual report below. You can navigate through the pages in the report by either clicking on the pages listed below, or by using the keyword search tool below to find specific information within the annual report.-
 1
1 -
2
-
3
-
4
-
5
-
6
-
7
-
8
-
9
-
10
-
11
-
12
-
13
-
14
-
15
-
16
-
17
-
18
-
19
-
20
-
21
-
22
-
23
-
24
-
25
-
26
-
27
-
28
-
29
-
30
-
31
-
32
-
33
-
34
-
35
-
36
-
37
-
38
-
39
-
40
-
41
-
42
-
43
-
44
-
45
-
46
-
47
-
48
-
49
-
50
-
51
-
52
-
53
-
54
-
55
-
56
-
57
-
58
-
59
-
60
-
61
-
62
-
63
-
64
-
65
-
66
-
67
-
68
-
69
-
70
-
71
-
72
-
73
-
74
-
75
-
76
-
77
-
78
-
79
-
80
-
81
-
82
-
83
-
84
-
85
-
86
-
87
-
88
-
89
-
90
-
91
-
92
-
93
-
94
-
95
-
96
-
97
-
98
-
99
-
100
-
101
-
102
-
103
-
104
-
105
-
106
-
107
-
108
-
109
-
110
-
111
-
112
-
113
-
114
-
115
-
116
-
117
-
118
-
119
-
120
-
121
-
122
-
123
-
124
-
125
-
126
-
127
-
128
-
129
-
130
-
131
-
132
-
133
-
134
-
135
-
136
-
137
-
138
-
139
-
140
-
141
-
142
-
143
-
144
-
145
-
146
-
147
-
148
-
149
-
150
-
151
-
152
-
153
-
154
-
155
-
156
-
157
-
158
-
159
-
160
-
161
-
162
-
163
-
164
-
165
-
166
-
167
-
168
-
169
-
170
-
171
-
172
-
173
-
174
-
175
-
176
-
177
-
178
-
179
-
180
-
181
-
182
-
183
-
184
-
185
-
186
-
187
-
188
-
189
-
190
-
191
-
192
-
193
-
194
-
195
-
196
-
197
-
198
-
199
-
200
-
201
-
202
-
203
-
204
-
205
-
206
-
207
-
208
-
209
-
210
-
211
-
212
-
213
-
214
-
215
-
216
-
217
-
218
-
219
-
220
-
221
-
222
-
223
-
224
-
225
-
226
-
227
-
228
-
229
-
230
-
231
-
232
-
233
-
234
-
235
-
236
-
237
-
238
-
239
-
240
-
241
-
242
-
243
-
244
-
245
-
246
-
247
-
248
-
249
-
250
-
251
-
252
-
253
-
254
-
255
-
256
-
257
-
 258
258 -
 259
259 -
 260
260 -
 261
261 -
 262
262 -
 263
263 -
 264
264 -
 265
265 -
 266
266 -
 267
267 -
 268
268 -
 269
269 -
 270
270 -
 271
271 -
 272
272 -
 273
273 -
 274
274 -
 275
275 -
 276
276 -
 277
277 -
 278
278 -
279
-
280
-
281
-
282
-
283
-
284
-
285
-
286
-
287
-
288
-
289
-
290
-
291
-
292
-
293
-
294
-
295
-
296
-
297
 |
 |
NOTES TO THE CONSOLIDATED FINANCIAL STATEMENTS
ADDITIONAL DISCLOSURES
CONSOLIDATED FINANCIAL STATEMENTS
265
B
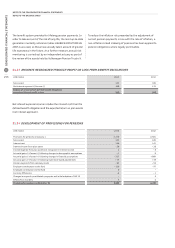
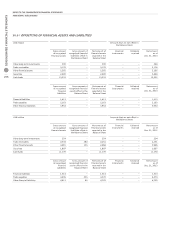
36.5 /
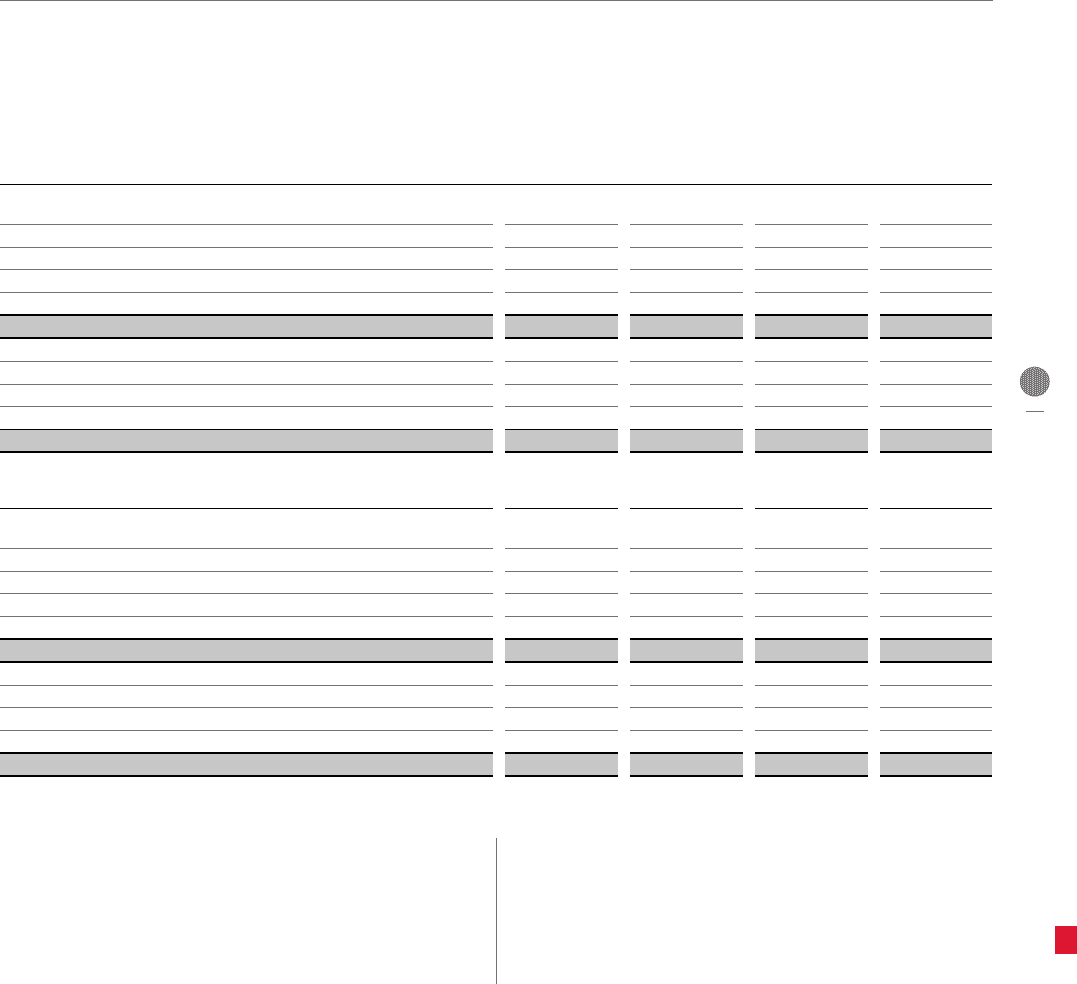
FINANCIAL INSTRUMENTS MEASURED AT COST
EUR million
Dec. 31, 2013 Level 1 Level 2 Level 3
Other long-term investments 290 – 102 189
Trade receivables 3,176 – 3,176 –
Other financial assets 1,160 – 1,160 –
Cash funds 13,332 6,540 6,792 –
Fair values of financial assets measured at amortized cost 17,958 6,540 11,230 189
Trade payables 5,163 – 5,163 –
Financial liabilities 1,413 – 1,413 –
Other financial liabilities 3,541 – 3,541 –
Fair values of financial liabilities measured at amortized cost 10,116 – 10,116 –
EUR million
Dec. 31, 2012 Level 1 Level 2 Level 3
Other long-term investments 254 – 90 164
Trade receivables 2,251 – 2,251 –
Other financial assets 2,297 – 2,297 –
Cash funds 11,170 4,281 6,889 –
Fair values of financial assets measured at amortized cost 15,973 4,281 11,528 164
Trade payables 4,270 – 4,270 –
Financial liabilities 1,312 – 1,312 –
Other financial liabilities 4,253 – 4,253 –
Fair values of financial liabilities measured at amortized cost 9,835 – 9,835 –
In the case of the financial instruments measured at amortized
cost, the fair value levels to be quoted basically correspond to
the criteria listed under Note 36.1. The fair value of these finan-
cial instruments, such as receivables and liabilities, is calculated
by discounting using a market interest rate that adequately
reflects the risks and is based on matched maturities.
Within non-current assets and liabilities, there were no signifi-
cant changes in the ratios between balance sheet value and
fair value. For reasons of materiality, the fair value for current
balance sheet items is equated with the balance sheet value.