Audi 2013 Annual Report Download - page 177
Download and view the complete annual report
Please find page 177 of the 2013 Audi annual report below. You can navigate through the pages in the report by either clicking on the pages listed below, or by using the keyword search tool below to find specific information within the annual report.-
 1
1 -
2
-
3
-
4
-
5
-
6
-
7
-
8
-
9
-
10
-
11
-
12
-
13
-
14
-
15
-
16
-
17
-
18
-
19
-
20
-
21
-
22
-
23
-
24
-
25
-
26
-
27
-
28
-
29
-
30
-
31
-
32
-
33
-
34
-
35
-
36
-
37
-
38
-
39
-
40
-
41
-
42
-
43
-
44
-
45
-
46
-
47
-
48
-
49
-
50
-
51
-
52
-
53
-
54
-
55
-
56
-
57
-
58
-
59
-
60
-
61
-
62
-
63
-
64
-
65
-
66
-
67
-
68
-
69
-
70
-
71
-
72
-
73
-
74
-
75
-
76
-
77
-
78
-
79
-
80
-
81
-
82
-
83
-
84
-
85
-
86
-
87
-
88
-
89
-
90
-
91
-
92
-
93
-
94
-
95
-
96
-
97
-
98
-
99
-
100
-
101
-
102
-
103
-
104
-
105
-
106
-
107
-
108
-
109
-
110
-
111
-
112
-
113
-
114
-
115
-
116
-
117
-
118
-
119
-
120
-
121
-
122
-
123
-
124
-
125
-
126
-
127
-
128
-
129
-
130
-
131
-
132
-
133
-
134
-
135
-
136
-
137
-
138
-
139
-
140
-
141
-
142
-
143
-
144
-
145
-
146
-
147
-
148
-
149
-
150
-
151
-
152
-
153
-
154
-
155
-
156
-
157
-
158
-
159
-
160
-
161
-
162
-
163
-
164
-
165
-
166
-
 167
167 -
 168
168 -
 169
169 -
 170
170 -
 171
171 -
 172
172 -
 173
173 -
 174
174 -
 175
175 -
 176
176 -
 177
177 -
 178
178 -
 179
179 -
 180
180 -
 181
181 -
 182
182 -
 183
183 -
 184
184 -
 185
185 -
 186
186 -
 187
187 -
188
-
189
-
190
-
191
-
192
-
193
-
194
-
195
-
196
-
197
-
198
-
199
-
200
-
201
-
202
-
203
-
204
-
205
-
206
-
207
-
208
-
209
-
210
-
211
-
212
-
213
-
214
-
215
-
216
-
217
-
218
-
219
-
220
-
221
-
222
-
223
-
224
-
225
-
226
-
227
-
228
-
229
-
230
-
231
-
232
-
233
-
234
-
235
-
236
-
237
-
238
-
239
-
240
-
241
-
242
-
243
-
244
-
245
-
246
-
247
-
248
-
249
-
250
-
251
-
252
-
253
-
254
-
255
-
256
-
257
-
258
-
259
-
260
-
261
-
262
-
263
-
264
-
265
-
266
-
267
-
268
-
269
-
270
-
271
-
272
-
273
-
274
-
275
-
276
-
277
-
278
-
279
-
280
-
281
-
282
-
283
-
284
-
285
-
286
-
287
-
288
-
289
-
290
-
291
-
292
-
293
-
294
-
295
-
296
-
297
 |
 |

FINANCIAL PERFORMANCE INDICATORS
FINANCIAL PERFORMANCE
MANAGEMENT REPORT
174
A
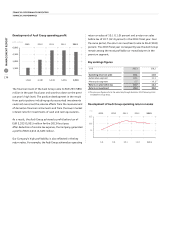
Development of Audi Group operating profit
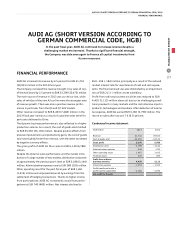
The financial result of the Audi Group came to EUR 293 (586)
million in the past fiscal year and was thus down on the previ-
ous year’s high level. The positive development in the result
from participations including equity-accounted investments
could not cancel out the adverse effects from the measurement
of derivative financial instruments and from the lower market
interest rate for investments of cash and cash equivalents.
As a result, the Audi Group achieved a profit before tax of
EUR 5,323 (5,951) million for the 2013 fiscal year.
After deduction of income tax expense, the Company generated
a profit of EUR 4,014 (4,349) million.
Our Company’s high profitability is also reflected in the key
return ratios. For example, the Audi Group achieved an operating
return on sales of 10.1 (11.0) percent and a return on sales
before tax of 10.7 (12.2) percent in the 2013 fiscal year. Over
the same period, the return on investment came to 26.4 (30.8)
percent. The 2013 fiscal year consequently saw the Audi Group
remain among the most profitable car manufacturers in the
premium segment.
Key earnings figures
in %
2013 2012
Operating return on sales 10.1 11.0
Automotive segment 10.1 11.1
Motorcycles segment 5.7 – 19.5 1)
Return on sales before tax 10.7 12.2
Return on investment 26.4 30.8
1) The prior-year figures refer to the period July through December 2012 following initial
consolidation in July 2012.
Development of Audi Group operating return on sales
6,000
4,500
3,000
1,500
2010 201220112009 2013
1,604 5,3483,340 5,0305,365
EUR million
15
10
5
2010 201220112009 2013
5.4 9.4 11.012.1 10.1
012345
(%)