Audi 2013 Annual Report Download - page 242
Download and view the complete annual report
Please find page 242 of the 2013 Audi annual report below. You can navigate through the pages in the report by either clicking on the pages listed below, or by using the keyword search tool below to find specific information within the annual report.-
 1
1 -
 2
2 -
 3
3 -
 4
4 -
 5
5 -
 6
6 -
 7
7 -
 8
8 -
 9
9 -
 10
10 -
 11
11 -
 12
12 -
 13
13 -
 14
14 -
 15
15 -
 16
16 -
 17
17 -
 18
18 -
 19
19 -
 20
20 -
 21
21 -
 22
22 -
 23
23 -
 24
24 -
 25
25 -
 26
26 -
 27
27 -
 28
28 -
 29
29 -
 30
30 -
 31
31 -
 32
32 -
 33
33 -
 34
34 -
 35
35 -
 36
36 -
 37
37 -
 38
38 -
 39
39 -
 40
40 -
 41
41 -
 42
42 -
 43
43 -
 44
44 -
 45
45 -
 46
46 -
 47
47 -
 48
48 -
 49
49 -
 50
50 -
 51
51 -
 52
52 -
 53
53 -
 54
54 -
 55
55 -
 56
56 -
 57
57 -
 58
58 -
 59
59 -
 60
60 -
 61
61 -
 62
62 -
 63
63 -
 64
64 -
 65
65 -
 66
66 -
 67
67 -
 68
68 -
 69
69 -
 70
70 -
 71
71 -
 72
72 -
 73
73 -
 74
74 -
 75
75 -
 76
76 -
 77
77 -
 78
78 -
 79
79 -
 80
80 -
 81
81 -
 82
82 -
 83
83 -
 84
84 -
 85
85 -
 86
86 -
 87
87 -
 88
88 -
 89
89 -
 90
90 -
 91
91 -
 92
92 -
 93
93 -
 94
94 -
 95
95 -
 96
96 -
 97
97 -
 98
98 -
 99
99 -
 100
100 -
 101
101 -
 102
102 -
 103
103 -
 104
104 -
 105
105 -
 106
106 -
 107
107 -
 108
108 -
 109
109 -
 110
110 -
 111
111 -
 112
112 -
 113
113 -
 114
114 -
 115
115 -
 116
116 -
 117
117 -
 118
118 -
 119
119 -
 120
120 -
 121
121 -
 122
122 -
 123
123 -
 124
124 -
 125
125 -
 126
126 -
 127
127 -
 128
128 -
 129
129 -
 130
130 -
 131
131 -
 132
132 -
 133
133 -
 134
134 -
 135
135 -
 136
136 -
 137
137 -
 138
138 -
 139
139 -
 140
140 -
 141
141 -
 142
142 -
 143
143 -
 144
144 -
 145
145 -
 146
146 -
 147
147 -
 148
148 -
 149
149 -
 150
150 -
 151
151 -
 152
152 -
 153
153 -
 154
154 -
 155
155 -
 156
156 -
 157
157 -
 158
158 -
 159
159 -
 160
160 -
 161
161 -
 162
162 -
 163
163 -
 164
164 -
 165
165 -
 166
166 -
 167
167 -
 168
168 -
 169
169 -
 170
170 -
 171
171 -
 172
172 -
 173
173 -
 174
174 -
 175
175 -
 176
176 -
 177
177 -
 178
178 -
 179
179 -
 180
180 -
 181
181 -
 182
182 -
 183
183 -
 184
184 -
 185
185 -
 186
186 -
 187
187 -
 188
188 -
 189
189 -
 190
190 -
 191
191 -
 192
192 -
 193
193 -
 194
194 -
 195
195 -
 196
196 -
 197
197 -
 198
198 -
 199
199 -
 200
200 -
 201
201 -
 202
202 -
 203
203 -
 204
204 -
 205
205 -
 206
206 -
 207
207 -
 208
208 -
 209
209 -
 210
210 -
 211
211 -
 212
212 -
 213
213 -
 214
214 -
 215
215 -
 216
216 -
 217
217 -
 218
218 -
 219
219 -
 220
220 -
 221
221 -
 222
222 -
 223
223 -
 224
224 -
 225
225 -
 226
226 -
 227
227 -
 228
228 -
 229
229 -
 230
230 -
 231
231 -
 232
232 -
 233
233 -
 234
234 -
 235
235 -
 236
236 -
 237
237 -
 238
238 -
 239
239 -
 240
240 -
 241
241 -
 242
242 -
 243
243 -
 244
244 -
 245
245 -
 246
246 -
 247
247 -
 248
248 -
 249
249 -
 250
250 -
 251
251 -
 252
252 -
 253
253 -
 254
254 -
 255
255 -
 256
256 -
 257
257 -
 258
258 -
 259
259 -
 260
260 -
 261
261 -
 262
262 -
 263
263 -
 264
264 -
 265
265 -
 266
266 -
 267
267 -
 268
268 -
 269
269 -
 270
270 -
 271
271 -
 272
272 -
 273
273 -
 274
274 -
 275
275 -
 276
276 -
 277
277 -
 278
278 -
 279
279 -
 280
280 -
 281
281 -
 282
282 -
 283
283 -
 284
284 -
 285
285 -
 286
286 -
 287
287 -
 288
288 -
 289
289 -
 290
290 -
 291
291 -
 292
292 -
 293
293 -
 294
294 -
 295
295 -
 296
296 -
 297
297
 |
 |
NOTES TO THE CONSOLIDATED FINANCIAL STATEMENTS
NOTES TO THE INCOME STATEMENT
CONSOLIDATED FINANCIAL STATEMENTS
239
B
NOTES TO THE INCOME STATEMENT
1 /
REVENUE
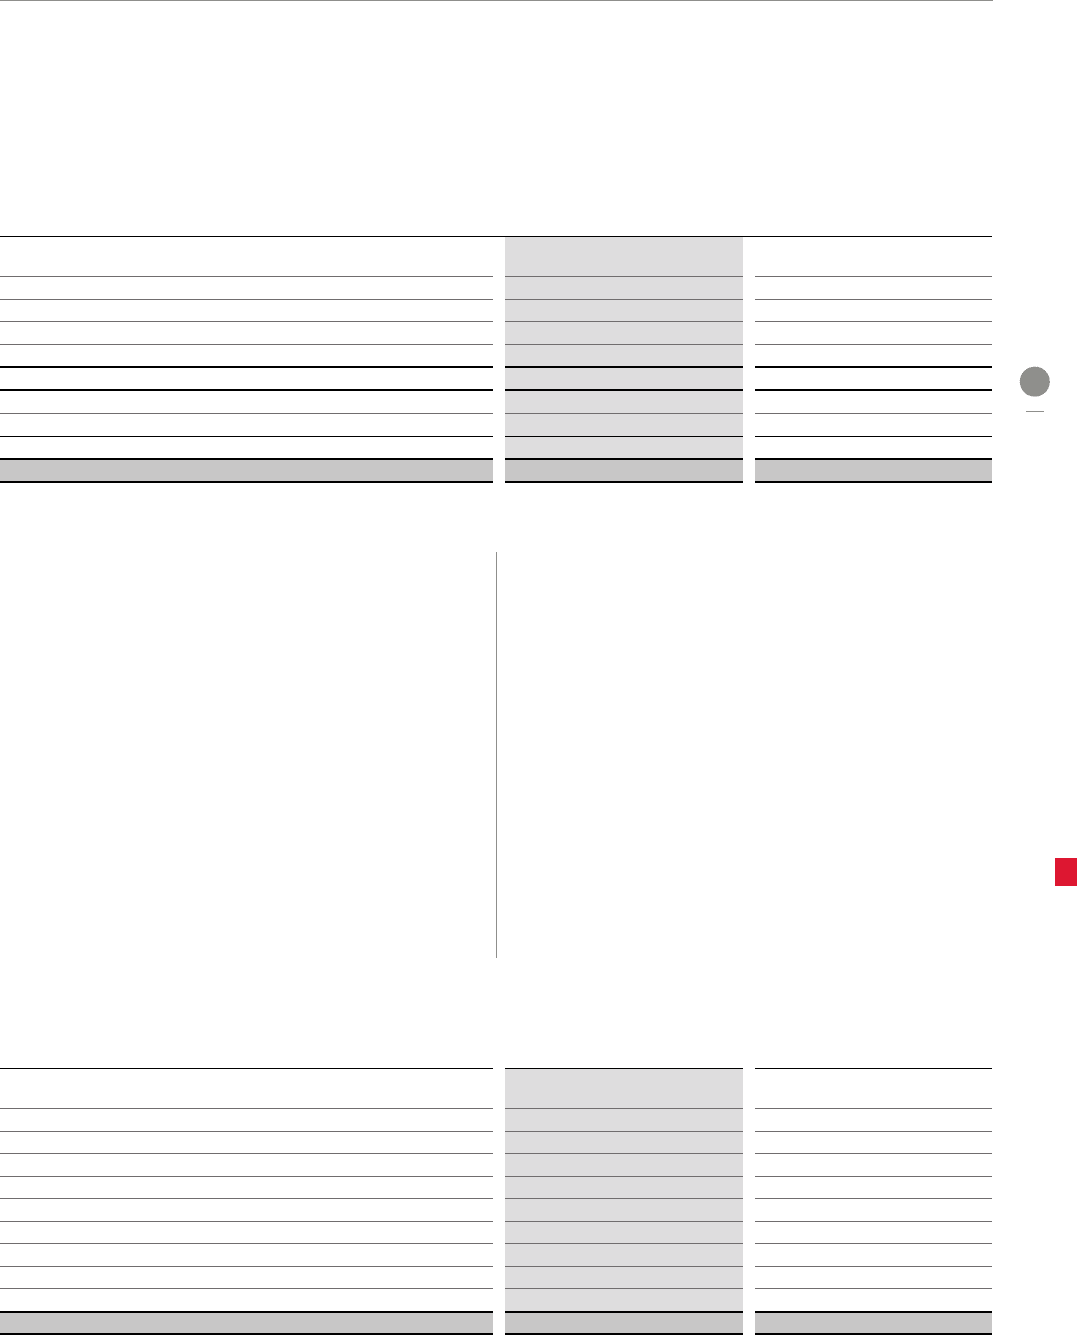
EUR million
2013 2012
Audi brand 35,827 35,851
Lamborghini brand 458 421
Other Volkswagen Group brands 2,827 2,725
Other automotive business 10,194 9,565
Automotive 49,307 48,562
Ducati brand 450 148
Other motorcycles business 123 61
Motorcycles 573 209
Revenue 49,880 48,771
As well as sales generated by the Audi and Lamborghini brands,
revenue from the Automotive segment also includes revenue
from the other brands in the Volkswagen Group. Revenue from
other automotive business primarily includes deliveries of parts
sets to China as well as proceeds from the sale of engines and
genuine parts. Revenue from the Motorcycles segment include
sales of Ducati motorcycles.
2 /
COST OF GOODS SOLD
Amounting to EUR 40,691 (39,061) million, cost of goods sold
comprises the costs incurred in generating revenue and pur-
chase prices in trading transactions. This item also includes
expenses resulting from the formation of provisions for warran-
ty costs, for development costs that cannot be capitalized, for
depreciation and impairment losses of capitalized development
costs, and for property, plant and equipment for manufacturing
purposes. During the 2013 fiscal year there was only a low
level of impairment losses on property, plant and equipment
and intangible assets (previous year: EUR 3 million).
3 /
DISTRIBUTION COSTS
Distribution costs of EUR 4,641 (4,594) million substantially
comprise labor and materials costs for marketing and sales
promotion, advertising, public relations activities and out-
ward freight, as well as depreciation attributable to the sales
organization.
4 /
ADMINISTRATIVE EXPENSES
Administrative expenses of EUR 566 (527) million include labor
and other costs, as well as depreciation attributable to admin-
istrative operations.
5 /
OTHER OPERATING INCOME
EUR million
2013 2012
Income from derivative hedging transactions 493 127
Income from rebilling 473 475
Income from the dissolution of provisions 240 544
Income from ancillary business 223 205
Income from the processing of payments in foreign currency 142 251
Income from the disposal of assets 12 4
Income from the reversal of impairment losses of receivables and other assets 1 6
Income from the write-up of intangible assets 0 20
Miscellaneous operating income 368 249
Other operating income 1,952 1,881
