Audi 2013 Annual Report Download - page 257
Download and view the complete annual report
Please find page 257 of the 2013 Audi annual report below. You can navigate through the pages in the report by either clicking on the pages listed below, or by using the keyword search tool below to find specific information within the annual report.-
 1
1 -
2
-
3
-
4
-
5
-
6
-
7
-
8
-
9
-
10
-
11
-
12
-
13
-
14
-
15
-
16
-
17
-
18
-
19
-
20
-
21
-
22
-
23
-
24
-
25
-
26
-
27
-
28
-
29
-
30
-
31
-
32
-
33
-
34
-
35
-
36
-
37
-
38
-
39
-
40
-
41
-
42
-
43
-
44
-
45
-
46
-
47
-
48
-
49
-
50
-
51
-
52
-
53
-
54
-
55
-
56
-
57
-
58
-
59
-
60
-
61
-
62
-
63
-
64
-
65
-
66
-
67
-
68
-
69
-
70
-
71
-
72
-
73
-
74
-
75
-
76
-
77
-
78
-
79
-
80
-
81
-
82
-
83
-
84
-
85
-
86
-
87
-
88
-
89
-
90
-
91
-
92
-
93
-
94
-
95
-
96
-
97
-
98
-
99
-
100
-
101
-
102
-
103
-
104
-
105
-
106
-
107
-
108
-
109
-
110
-
111
-
112
-
113
-
114
-
115
-
116
-
117
-
118
-
119
-
120
-
121
-
122
-
123
-
124
-
125
-
126
-
127
-
128
-
129
-
130
-
131
-
132
-
133
-
134
-
135
-
136
-
137
-
138
-
139
-
140
-
141
-
142
-
143
-
144
-
145
-
146
-
147
-
148
-
149
-
150
-
151
-
152
-
153
-
154
-
155
-
156
-
157
-
158
-
159
-
160
-
161
-
162
-
163
-
164
-
165
-
166
-
167
-
168
-
169
-
170
-
171
-
172
-
173
-
174
-
175
-
176
-
177
-
178
-
179
-
180
-
181
-
182
-
183
-
184
-
185
-
186
-
187
-
188
-
189
-
190
-
191
-
192
-
193
-
194
-
195
-
196
-
197
-
198
-
199
-
200
-
201
-
202
-
203
-
204
-
205
-
206
-
207
-
208
-
209
-
210
-
211
-
212
-
213
-
214
-
215
-
216
-
217
-
218
-
219
-
220
-
221
-
222
-
223
-
224
-
225
-
226
-
227
-
228
-
229
-
230
-
231
-
232
-
233
-
234
-
235
-
236
-
237
-
238
-
239
-
240
-
241
-
242
-
243
-
244
-
245
-
246
-
 247
247 -
 248
248 -
 249
249 -
 250
250 -
 251
251 -
 252
252 -
 253
253 -
 254
254 -
 255
255 -
 256
256 -
 257
257 -
 258
258 -
 259
259 -
 260
260 -
 261
261 -
 262
262 -
 263
263 -
 264
264 -
 265
265 -
 266
266 -
 267
267 -
268
-
269
-
270
-
271
-
272
-
273
-
274
-
275
-
276
-
277
-
278
-
279
-
280
-
281
-
282
-
283
-
284
-
285
-
286
-
287
-
288
-
289
-
290
-
291
-
292
-
293
-
294
-
295
-
296
-
297
 |
 |
NOTES TO THE CONSOLIDATED FINANCIAL STATEMENTS
NOTES TO THE BALANCE SHEET
CONSOLIDATED FINANCIAL STATEMENTS
254
B
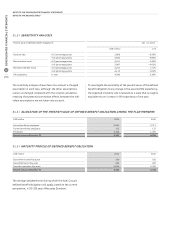
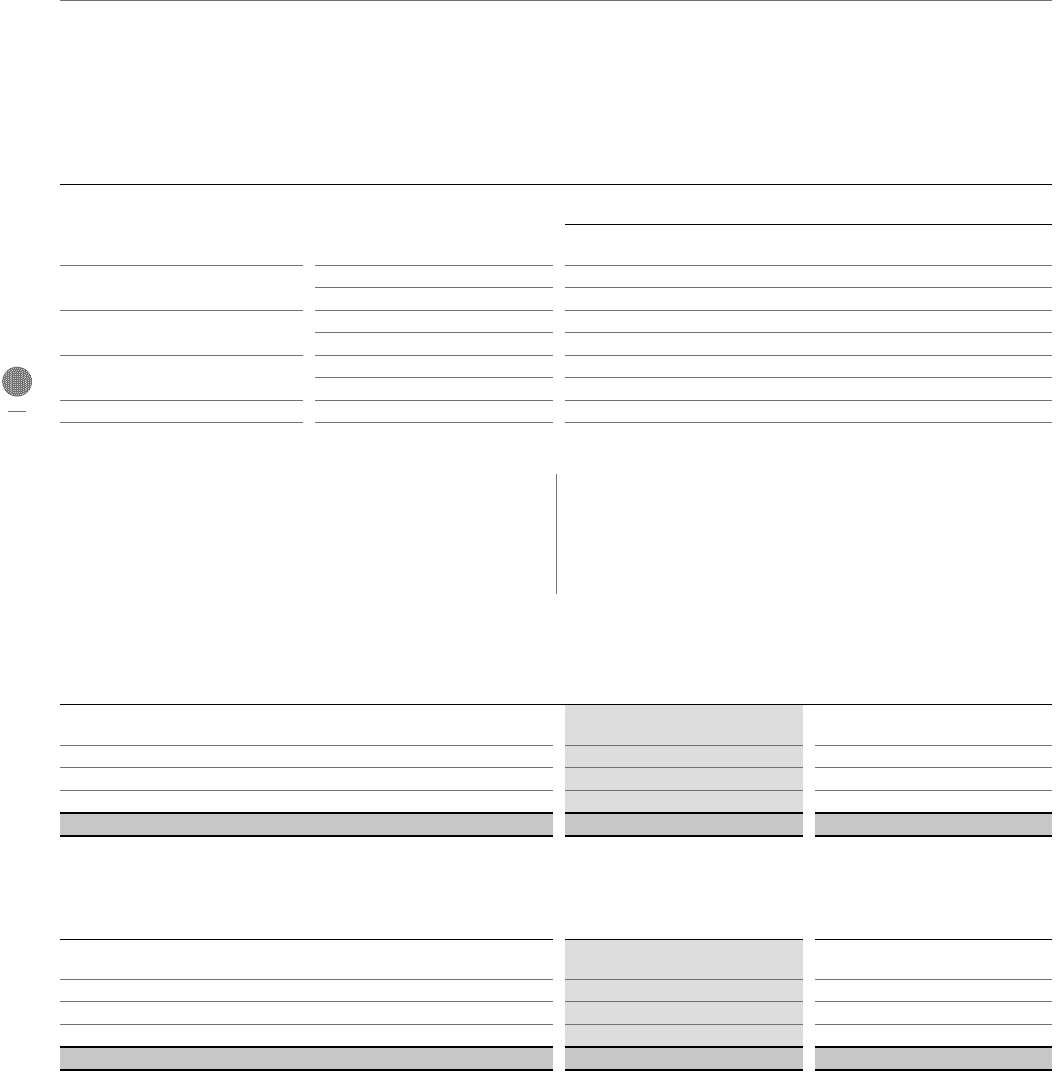
31.3 /
SENSITIVITY ANALYSIS
Present value of defined benefit obligation if Dec. 31, 2013
EUR million in %
Discount rate +0.5 percentage points 3,906 –6.58%
–0.5 percentage points 4,594 9.86%
Remuneration trend +0.5 percentage points 4,411 5.49%
–0.5 percentage points 3,987 –4.65%
Retirement benefit trend +0.5 percentage points 4,253 1.71%
–0.5 percentage points 4,113 –1.63%
Life expectancy +1 year 4,280 2.36%
The sensitivity analyses shown take into account a changed
assumption in each case, although the other assumptions
remain unchanged compared with the original calculation,
meaning that potential correlation effects between the indi-
vidual assumptions are not taken into account.
To investigate the sensitivity of the present value of the defined
benefit obligation to any change in the assumed life expectancy,
the expected mortality rate is reduced on a scale that is roughly
equivalent to an increase in life expectancy of one year.
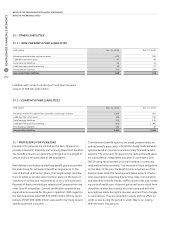
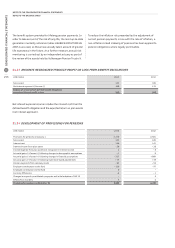
31.4 /
ALLOCATION OF THE PRESENT VALUE OF DEFINED BENEFIT OBLIGATION AMONG THE PLAN MEMBERS
EUR million
2013 2012
Active beneficiary employees 2,663 2,711
Former beneficiary employees 113 127
Pensioners 1,406 1,476
Present value on December 31 4,181 4,314
31.5 /
MATURITY PROFILE OF DEFINED BENEFIT OBLIGATION
EUR million
2013 2012
Due within the next fiscal year 100 102
Due within two to five years 449 467
Due after more than five years 3,632 3,744
Present value on December 31 4,181 4,314
The average weighted term during which the Audi Group’s
defined benefit obligation will apply, based on the current
perspective, is 20 (20) years (Macaulay Duration).