Audi 2013 Annual Report Download - page 243
Download and view the complete annual report
Please find page 243 of the 2013 Audi annual report below. You can navigate through the pages in the report by either clicking on the pages listed below, or by using the keyword search tool below to find specific information within the annual report.-
 1
1 -
2
-
3
-
4
-
5
-
6
-
7
-
8
-
9
-
10
-
11
-
12
-
13
-
14
-
15
-
16
-
17
-
18
-
19
-
20
-
21
-
22
-
23
-
24
-
25
-
26
-
27
-
28
-
29
-
30
-
31
-
32
-
33
-
34
-
35
-
36
-
37
-
38
-
39
-
40
-
41
-
42
-
43
-
44
-
45
-
46
-
47
-
48
-
49
-
50
-
51
-
52
-
53
-
54
-
55
-
56
-
57
-
58
-
59
-
60
-
61
-
62
-
63
-
64
-
65
-
66
-
67
-
68
-
69
-
70
-
71
-
72
-
73
-
74
-
75
-
76
-
77
-
78
-
79
-
80
-
81
-
82
-
83
-
84
-
85
-
86
-
87
-
88
-
89
-
90
-
91
-
92
-
93
-
94
-
95
-
96
-
97
-
98
-
99
-
100
-
101
-
102
-
103
-
104
-
105
-
106
-
107
-
108
-
109
-
110
-
111
-
112
-
113
-
114
-
115
-
116
-
117
-
118
-
119
-
120
-
121
-
122
-
123
-
124
-
125
-
126
-
127
-
128
-
129
-
130
-
131
-
132
-
133
-
134
-
135
-
136
-
137
-
138
-
139
-
140
-
141
-
142
-
143
-
144
-
145
-
146
-
147
-
148
-
149
-
150
-
151
-
152
-
153
-
154
-
155
-
156
-
157
-
158
-
159
-
160
-
161
-
162
-
163
-
164
-
165
-
166
-
167
-
168
-
169
-
170
-
171
-
172
-
173
-
174
-
175
-
176
-
177
-
178
-
179
-
180
-
181
-
182
-
183
-
184
-
185
-
186
-
187
-
188
-
189
-
190
-
191
-
192
-
193
-
194
-
195
-
196
-
197
-
198
-
199
-
200
-
201
-
202
-
203
-
204
-
205
-
206
-
207
-
208
-
209
-
210
-
211
-
212
-
213
-
214
-
215
-
216
-
217
-
218
-
219
-
220
-
221
-
222
-
223
-
224
-
225
-
226
-
227
-
228
-
229
-
230
-
231
-
232
-
 233
233 -
 234
234 -
 235
235 -
 236
236 -
 237
237 -
 238
238 -
 239
239 -
 240
240 -
 241
241 -
 242
242 -
 243
243 -
 244
244 -
 245
245 -
 246
246 -
 247
247 -
 248
248 -
 249
249 -
 250
250 -
 251
251 -
 252
252 -
 253
253 -
254
-
255
-
256
-
257
-
258
-
259
-
260
-
261
-
262
-
263
-
264
-
265
-
266
-
267
-
268
-
269
-
270
-
271
-
272
-
273
-
274
-
275
-
276
-
277
-
278
-
279
-
280
-
281
-
282
-
283
-
284
-
285
-
286
-
287
-
288
-
289
-
290
-
291
-
292
-
293
-
294
-
295
-
296
-
297
 |
 |

NOTES TO THE CONSOLIDATED FINANCIAL STATEMENTS
NOTES TO THE INCOME STATEMENT
CONSOLIDATED FINANCIAL STATEMENTS
240
B
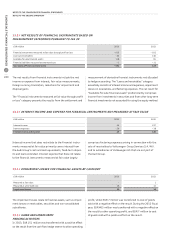
Income from derivative hedging transactions mainly results
from the settlement of currency hedging instruments. The
total position in relation to hedging transactions is presented
under Note 37.5, “Methods of monitoring the effectiveness of
hedging relationships.”
Income from ancillary business includes rental income from
investment property in the amount of EUR 12 (2) million.
Income from the processing of payments in foreign currency
substantially comprises gains resulting from exchange-rate
movements between the dates of output and payment, as well
as exchange-rate gains resulting from measurement on the
closing date. Similarly, exchange rate losses are reported
under other operating expenses.
Furthermore, grants for future-oriented technologies in the
amount of EUR 11 (6) million were recognized in income.
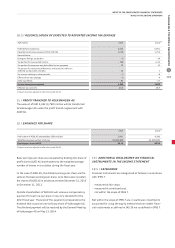
6 /
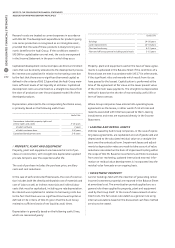
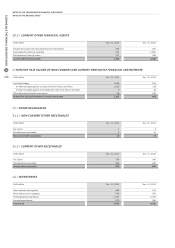
OTHER OPERATING EXPENSES
EUR million
2013 2012
Expenses from derivative hedging transactions 306 630
Expenses from the processing of payments in foreign currency 206 218
Expenses from the allocation and rebilling of costs 102 81
Impairment losses on receivables 16 14
Losses on disposal of assets 6 10
Miscellaneous operating expenses 267 152
Other operating expenses 903 1,106
Expenses from derivative hedging transactions mainly result
from premiums from foreign exchange option contracts and
the settlement of currency hedging instruments. The total
position in relation to hedging transactions is presented under
Note 37.5, “Methods of monitoring the effectiveness of hedg-
ing relationships.”
7 /
RESULT FROM INVESTMENTS ACCOUNTED FOR
USING THE EQUITY METHOD
The result from investments accounted for using the equity
method reached EUR 454 (415) million. FAW-Volkswagen
Automotive Company, Ltd. contributed a pro rata dividend of
EUR 382 (239) million.
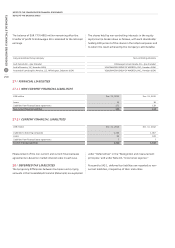
8 /
FINANCE EXPENSES
EUR million
2013 2012
Interest expenses 60 105
Interest effect from the measurement of pension provisions 108 113
Interest effect from the measurement of other provisions –10 182
Interest effect from the measurement of liabilities 0 2
Interest effect from compounding 98 298
Finance expenses 158 403
Interest expense is attributed on an accrual basis.