Audi 2013 Annual Report Download - page 176
Download and view the complete annual report
Please find page 176 of the 2013 Audi annual report below. You can navigate through the pages in the report by either clicking on the pages listed below, or by using the keyword search tool below to find specific information within the annual report.-
 1
1 -
2
-
3
-
4
-
5
-
6
-
7
-
8
-
9
-
10
-
11
-
12
-
13
-
14
-
15
-
16
-
17
-
18
-
19
-
20
-
21
-
22
-
23
-
24
-
25
-
26
-
27
-
28
-
29
-
30
-
31
-
32
-
33
-
34
-
35
-
36
-
37
-
38
-
39
-
40
-
41
-
42
-
43
-
44
-
45
-
46
-
47
-
48
-
49
-
50
-
51
-
52
-
53
-
54
-
55
-
56
-
57
-
58
-
59
-
60
-
61
-
62
-
63
-
64
-
65
-
66
-
67
-
68
-
69
-
70
-
71
-
72
-
73
-
74
-
75
-
76
-
77
-
78
-
79
-
80
-
81
-
82
-
83
-
84
-
85
-
86
-
87
-
88
-
89
-
90
-
91
-
92
-
93
-
94
-
95
-
96
-
97
-
98
-
99
-
100
-
101
-
102
-
103
-
104
-
105
-
106
-
107
-
108
-
109
-
110
-
111
-
112
-
113
-
114
-
115
-
116
-
117
-
118
-
119
-
120
-
121
-
122
-
123
-
124
-
125
-
126
-
127
-
128
-
129
-
130
-
131
-
132
-
133
-
134
-
135
-
136
-
137
-
138
-
139
-
140
-
141
-
142
-
143
-
144
-
145
-
146
-
147
-
148
-
149
-
150
-
151
-
152
-
153
-
154
-
155
-
156
-
157
-
158
-
159
-
160
-
161
-
162
-
163
-
164
-
165
-
 166
166 -
 167
167 -
 168
168 -
 169
169 -
 170
170 -
 171
171 -
 172
172 -
 173
173 -
 174
174 -
 175
175 -
 176
176 -
 177
177 -
 178
178 -
 179
179 -
 180
180 -
 181
181 -
 182
182 -
 183
183 -
 184
184 -
 185
185 -
 186
186 -
187
-
188
-
189
-
190
-
191
-
192
-
193
-
194
-
195
-
196
-
197
-
198
-
199
-
200
-
201
-
202
-
203
-
204
-
205
-
206
-
207
-
208
-
209
-
210
-
211
-
212
-
213
-
214
-
215
-
216
-
217
-
218
-
219
-
220
-
221
-
222
-
223
-
224
-
225
-
226
-
227
-
228
-
229
-
230
-
231
-
232
-
233
-
234
-
235
-
236
-
237
-
238
-
239
-
240
-
241
-
242
-
243
-
244
-
245
-
246
-
247
-
248
-
249
-
250
-
251
-
252
-
253
-
254
-
255
-
256
-
257
-
258
-
259
-
260
-
261
-
262
-
263
-
264
-
265
-
266
-
267
-
268
-
269
-
270
-
271
-
272
-
273
-
274
-
275
-
276
-
277
-
278
-
279
-
280
-
281
-
282
-
283
-
284
-
285
-
286
-
287
-
288
-
289
-
290
-
291
-
292
-
293
-
294
-
295
-
296
-
297
 |
 |

FINANCIAL PERFORMANCE INDICATORS
FINANCIAL PERFORMANCE
MANAGEMENT REPORT
173
A
FINANCIAL PERFORMANCE 1)
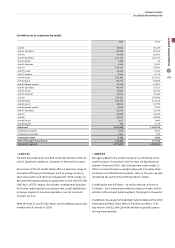
We increased the revenue of the Audi Group by 2.3 percent to
EUR 49,880 (48,771) million in the 2013 fiscal year. In the
Automotive segment, we generated revenue of EUR 35,827
(35,851) million through sales of vehicles of the core brand Audi.
While the A4 car line reasserted its status as the main source
of revenue last year, we achieved the strongest revenue growth
with sales of vehicles of the new A3 car line. A renewed rise in
demand for the Q3, Q5 and Q7 SUV models also impacted the
revenue trend positively. At the same time, however, this was
hampered by currency effects.
Revenue for the Lamborghini brand developed very favorably in
the past fiscal year, thanks especially to high demand for the
Aventador, and easily exceeded the prior-year total.
In addition to models of the Audi and Lamborghini brands,
the Audi Group sells vehicles of the Bentley, SEAT, Škoda, VW
Passenger Cars and VW Commercial Vehicles brands through
the Group-owned sales subsidiaries VOLKSWAGEN GROUP
ITALIA S.P.A., Verona (Italy), Audi Volkswagen Korea Ltd., Seoul
(South Korea), AUDI VOLKSWAGEN MIDDLE EAST FZE, Dubai
(United Arab Emirates), and AUDI SINGAPORE PTE. LTD.,
Singapore (Singapore). Despite the challenging competitive
environment – especially in European car markets – we in-
creased the revenue from trading of these brands compared
with the previous year’s level.
In the Motorcycles segment, the Company generated revenue
of EUR 573 (209) million in the 2013 fiscal year; the prior-year
figure comprises only the period since the acquisition of the
Ducati Group in July 2012.
Other revenue increased significantly in the past fiscal year to
EUR 10,317 (9,626) million largely as a result of higher sales
of parts sets delivered to China.
Hand in hand with the dynamic business performance and the
higher production volume, the cost of goods sold for the Audi
Group climbed to EUR 40,691 (39,061) million. Despite the
positive effects from productivity advances and process im-
provements, the cost of goods sold rose slightly faster than
revenue, with the latter burdened by negative currency effects.
The gross profit of the Audi Group thus reached EUR 9,188
(9,711) million in the year under review.
There was only a slight increase in distribution costs for the
Audi Group to EUR 4,641 (4,594) million in the 2013 fiscal year
despite the dynamic growth in our vehicle sales and the large
number of market introductions. Administrative expenses
climbed to EUR 566 (527) million mainly as a result of the
Audi Group’s general growth and consolidation effects follow-
ing the acquisition of the Ducati Group. Other operating result
rose to EUR 1,049 (775) million above all thanks to improved
earnings from the settlement of currency hedging transactions.
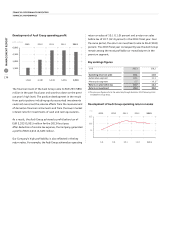
In view of the cost-intensive input needed for new products and
technologies, the financial burden of systematically expanding
our international production network and the challenging
conditions prevalent in many markets, operating profit for the
Audi Group of EUR 5,030 (5,365) million in 2013 was just below
the previous year’s high level. Within this total, the Automotive
segment achieved an operating profit of EUR 4,997 (5,405)
million. Taking account of additional depreciation due to the
revaluation of assets and liabilities for purchase price alloca-
tion, the Motorcycles segment generated an operating profit
of EUR 33 (– 41) million. Adjusted for these effects, operating
profit reached EUR 59 (– 23) million.
FINANCIAL PERFORMANCE INDICATORS
The Audi Group maintained its successful course of growth in the 2013 fiscal
year. With an operating return on sales of 10.1 percent, the Audi Group is
among the most profitable companies in the automotive industry worldwide.
1) Prior-year figures have been adjusted to reflect the revised IAS 19.