Audi 2013 Annual Report Download - page 248
Download and view the complete annual report
Please find page 248 of the 2013 Audi annual report below. You can navigate through the pages in the report by either clicking on the pages listed below, or by using the keyword search tool below to find specific information within the annual report.-
 1
1 -
2
-
3
-
4
-
5
-
6
-
7
-
8
-
9
-
10
-
11
-
12
-
13
-
14
-
15
-
16
-
17
-
18
-
19
-
20
-
21
-
22
-
23
-
24
-
25
-
26
-
27
-
28
-
29
-
30
-
31
-
32
-
33
-
34
-
35
-
36
-
37
-
38
-
39
-
40
-
41
-
42
-
43
-
44
-
45
-
46
-
47
-
48
-
49
-
50
-
51
-
52
-
53
-
54
-
55
-
56
-
57
-
58
-
59
-
60
-
61
-
62
-
63
-
64
-
65
-
66
-
67
-
68
-
69
-
70
-
71
-
72
-
73
-
74
-
75
-
76
-
77
-
78
-
79
-
80
-
81
-
82
-
83
-
84
-
85
-
86
-
87
-
88
-
89
-
90
-
91
-
92
-
93
-
94
-
95
-
96
-
97
-
98
-
99
-
100
-
101
-
102
-
103
-
104
-
105
-
106
-
107
-
108
-
109
-
110
-
111
-
112
-
113
-
114
-
115
-
116
-
117
-
118
-
119
-
120
-
121
-
122
-
123
-
124
-
125
-
126
-
127
-
128
-
129
-
130
-
131
-
132
-
133
-
134
-
135
-
136
-
137
-
138
-
139
-
140
-
141
-
142
-
143
-
144
-
145
-
146
-
147
-
148
-
149
-
150
-
151
-
152
-
153
-
154
-
155
-
156
-
157
-
158
-
159
-
160
-
161
-
162
-
163
-
164
-
165
-
166
-
167
-
168
-
169
-
170
-
171
-
172
-
173
-
174
-
175
-
176
-
177
-
178
-
179
-
180
-
181
-
182
-
183
-
184
-
185
-
186
-
187
-
188
-
189
-
190
-
191
-
192
-
193
-
194
-
195
-
196
-
197
-
198
-
199
-
200
-
201
-
202
-
203
-
204
-
205
-
206
-
207
-
208
-
209
-
210
-
211
-
212
-
213
-
214
-
215
-
216
-
217
-
218
-
219
-
220
-
221
-
222
-
223
-
224
-
225
-
226
-
227
-
228
-
229
-
230
-
231
-
232
-
233
-
234
-
235
-
236
-
237
-
 238
238 -
 239
239 -
 240
240 -
 241
241 -
 242
242 -
 243
243 -
 244
244 -
 245
245 -
 246
246 -
 247
247 -
 248
248 -
 249
249 -
 250
250 -
 251
251 -
 252
252 -
 253
253 -
 254
254 -
 255
255 -
 256
256 -
 257
257 -
 258
258 -
259
-
260
-
261
-
262
-
263
-
264
-
265
-
266
-
267
-
268
-
269
-
270
-
271
-
272
-
273
-
274
-
275
-
276
-
277
-
278
-
279
-
280
-
281
-
282
-
283
-
284
-
285
-
286
-
287
-
288
-
289
-
290
-
291
-
292
-
293
-
294
-
295
-
296
-
297
 |
 |

NOTES TO THE CONSOLIDATED FINANCIAL STATEMENTS
NOTES TO THE BALANCE SHEET
CONSOLIDATED FINANCIAL STATEMENTS
245
B
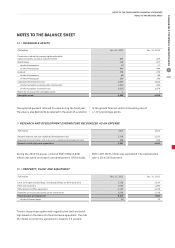
NOTES TO THE BALANCE SHEET
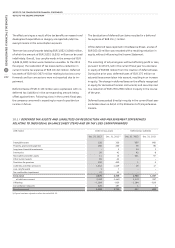
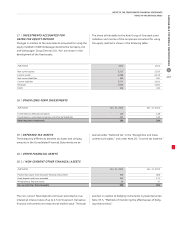
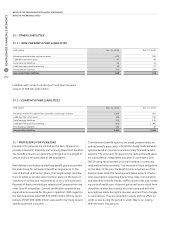
14 /
INTANGIBLE ASSETS
EUR million
Dec. 31, 2013 Dec. 31, 2012
Concessions, industrial proper iand similar
rights and assets, as well as licenses thereto 403 429
Brand names 418 421
of which Automotive 14 17
of which Motorcycles 404 404
Goodwill 378 378
of which Automotive 88 88
of which Motorcycles 290 290
Capitalized development costs 3,489 2,810
of which products currently under construction 1,833 834
of which products currently in use 1,656 1,976
Payments on account for intangible assets 1 1
Intangible assets 4,689 4,038
The reported goodwill retained its value during the fiscal year.
The value is also deemed to be retained in the event of a variation
in the growth forecast and/or discounting rate of
+/–0.5 percentage points.
//
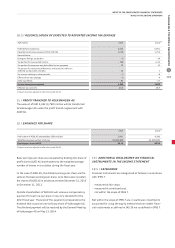
RESEARCH AND DEVELOPMENT EXPENDITURE RECOGNIZED AS AN EXPENSE
EUR million
2013 2012
Research expense and non-capitalized development costs 2,759 2,513
Depreciation/amortization and reversals on capitalized development costs 528 429
Research and development expenditure 3,287 2,942
During the 2013 fiscal year, a total of EUR 3,966 (3,435)
million was spent on research and development. Of this total,
EUR 1,207 (923) million was capitalized. The capitalization
rate is 30.4 (26.9) percent.
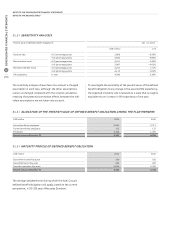
15 /
PROPERTY, PLANT AND EQUIPMENT
EUR million
Dec. 31, 2013 Dec. 31, 2012
Land, land rights and buildings, including buildings on third-party land 3,158 2,519
Plant and machinery 1,594 1,290
Other plant and office equipment 2,153 2,278
Payments on account and assets under construction 1,508 1,518
Property, plant and equipment 8,413 7,605
of which finance leases 24 20
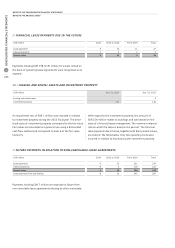
There is no purchase option with regard to the land and build-
ings leased on the basis of a financial lease agreement. The rate
of interest on which the agreement is based is 3.5 percent.