Audi 2013 Annual Report Download - page 144
Download and view the complete annual report
Please find page 144 of the 2013 Audi annual report below. You can navigate through the pages in the report by either clicking on the pages listed below, or by using the keyword search tool below to find specific information within the annual report.-
 1
1 -
2
-
3
-
4
-
5
-
6
-
7
-
8
-
9
-
10
-
11
-
12
-
13
-
14
-
15
-
16
-
17
-
18
-
19
-
20
-
21
-
22
-
23
-
24
-
25
-
26
-
27
-
28
-
29
-
30
-
31
-
32
-
33
-
34
-
35
-
36
-
37
-
38
-
39
-
40
-
41
-
42
-
43
-
44
-
45
-
46
-
47
-
48
-
49
-
50
-
51
-
52
-
53
-
54
-
55
-
56
-
57
-
58
-
59
-
60
-
61
-
62
-
63
-
64
-
65
-
66
-
67
-
68
-
69
-
70
-
71
-
72
-
73
-
74
-
75
-
76
-
77
-
78
-
79
-
80
-
81
-
82
-
83
-
84
-
85
-
86
-
87
-
88
-
89
-
90
-
91
-
92
-
93
-
94
-
95
-
96
-
97
-
98
-
99
-
100
-
101
-
102
-
103
-
104
-
105
-
106
-
107
-
108
-
109
-
110
-
111
-
112
-
113
-
114
-
115
-
116
-
117
-
118
-
119
-
120
-
121
-
122
-
123
-
124
-
125
-
126
-
127
-
128
-
129
-
130
-
131
-
132
-
133
-
 134
134 -
 135
135 -
 136
136 -
 137
137 -
 138
138 -
 139
139 -
 140
140 -
 141
141 -
 142
142 -
 143
143 -
 144
144 -
 145
145 -
 146
146 -
 147
147 -
 148
148 -
 149
149 -
 150
150 -
 151
151 -
 152
152 -
 153
153 -
 154
154 -
155
-
156
-
157
-
158
-
159
-
160
-
161
-
162
-
163
-
164
-
165
-
166
-
167
-
168
-
169
-
170
-
171
-
172
-
173
-
174
-
175
-
176
-
177
-
178
-
179
-
180
-
181
-
182
-
183
-
184
-
185
-
186
-
187
-
188
-
189
-
190
-
191
-
192
-
193
-
194
-
195
-
196
-
197
-
198
-
199
-
200
-
201
-
202
-
203
-
204
-
205
-
206
-
207
-
208
-
209
-
210
-
211
-
212
-
213
-
214
-
215
-
216
-
217
-
218
-
219
-
220
-
221
-
222
-
223
-
224
-
225
-
226
-
227
-
228
-
229
-
230
-
231
-
232
-
233
-
234
-
235
-
236
-
237
-
238
-
239
-
240
-
241
-
242
-
243
-
244
-
245
-
246
-
247
-
248
-
249
-
250
-
251
-
252
-
253
-
254
-
255
-
256
-
257
-
258
-
259
-
260
-
261
-
262
-
263
-
264
-
265
-
266
-
267
-
268
-
269
-
270
-
271
-
272
-
273
-
274
-
275
-
276
-
277
-
278
-
279
-
280
-
281
-
282
-
283
-
284
-
285
-
286
-
287
-
288
-
289
-
290
-
291
-
292
-
293
-
294
-
295
-
296
-
297
 |
 |

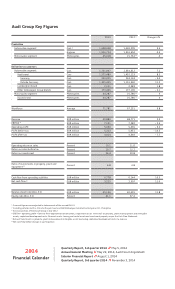
Audi Group Key Figures
2014
Financial Calendar
Quarterly Report, 1st quarter 2014 // May 5, 2014
Annual General Meeting // May 22, 2014, Audi Forum Ingolstadt
Interim Financial Report // August 1, 2014
Quarterly Report, 3rd quarter 2014 // November 3, 2014
1) Financial figures were adjusted to take account of the revised IAS 19
2) Including vehicles built in China by the joint venture FAW-Volkswagen Automotive Company, Ltd., Changchun
3) Since acquisition of the Ducati Group in July 2012
4) EBITDA = operating profit + balance from depreciation/amortization, impairment losses (reversals) on property, plant and equipment and intangible
assets, capitalized development costs, financial assets, leasing and rental assets and investment property as per the Cash Flow Statement
5) Ratio of investments in property, plant and equipment/intangible assets (excluding capitalized development costs) to revenue
6) Net cash flow before changes in participations
2013 2012 1) Change in %
Production
Automotive segment Cars 2) 1,608,048 1,469,205 9.5
Engines 1,926,724 1,916,604 0.5
Motorcycles segment Motorcycles 45,018 15,734 3) X
Deliveries to customers
Automotive segment Cars 1,751,007 1,634,312 7.1
Audi brand Cars 1,575,480 1,455,123 8.3
Germany Cars 250,025 263,163 – 5.0
Outside Germany Cars 1,325,455 1,191,960 11.2
Lamborghini brand Cars 2,121 2,083 1.8
Other Volkswagen Group brands Cars 173,406 177,106 – 2.1
Motorcycles segment Motorcycles 44,287 16,786 3) X
Ducati brand Motorcycles 44,287 16,786 3) X
Workforce Average 71,781 67,231 6.8
Revenue EUR million 49,880 48,771 2.3
EBITDA 4) EUR million 7,101 7,282 – 2.5
Operating profit EUR million 5,030 5,365 – 6.2
Profit before tax EUR million 5,323 5,951 – 10.5
Profit after tax EUR million 4,014 4,349 – 7.7
Operating return on sales Percent 10.1 11.0
Return on sales before tax Percent 10.7 12.2
Return on investment Percent 26.4 30.8
Ratio of investments in property, plant and
equipment 5) Percent 4.8 4.8
Cash flow from operating activities EUR million 6,778 6,144 10.3
Net cash flow 6) EUR million 3,225 2,907 11.0
Balance sheet total (Dec. 31) EUR million 45,156 40,401 11.8
Equity ratio (Dec. 31) Percent 41.1 37.4