Audi 2013 Annual Report Download - page 225
Download and view the complete annual report
Please find page 225 of the 2013 Audi annual report below. You can navigate through the pages in the report by either clicking on the pages listed below, or by using the keyword search tool below to find specific information within the annual report.-
 1
1 -
2
-
3
-
4
-
5
-
6
-
7
-
8
-
9
-
10
-
11
-
12
-
13
-
14
-
15
-
16
-
17
-
18
-
19
-
20
-
21
-
22
-
23
-
24
-
25
-
26
-
27
-
28
-
29
-
30
-
31
-
32
-
33
-
34
-
35
-
36
-
37
-
38
-
39
-
40
-
41
-
42
-
43
-
44
-
45
-
46
-
47
-
48
-
49
-
50
-
51
-
52
-
53
-
54
-
55
-
56
-
57
-
58
-
59
-
60
-
61
-
62
-
63
-
64
-
65
-
66
-
67
-
68
-
69
-
70
-
71
-
72
-
73
-
74
-
75
-
76
-
77
-
78
-
79
-
80
-
81
-
82
-
83
-
84
-
85
-
86
-
87
-
88
-
89
-
90
-
91
-
92
-
93
-
94
-
95
-
96
-
97
-
98
-
99
-
100
-
101
-
102
-
103
-
104
-
105
-
106
-
107
-
108
-
109
-
110
-
111
-
112
-
113
-
114
-
115
-
116
-
117
-
118
-
119
-
120
-
121
-
122
-
123
-
124
-
125
-
126
-
127
-
128
-
129
-
130
-
131
-
132
-
133
-
134
-
135
-
136
-
137
-
138
-
139
-
140
-
141
-
142
-
143
-
144
-
145
-
146
-
147
-
148
-
149
-
150
-
151
-
152
-
153
-
154
-
155
-
156
-
157
-
158
-
159
-
160
-
161
-
162
-
163
-
164
-
165
-
166
-
167
-
168
-
169
-
170
-
171
-
172
-
173
-
174
-
175
-
176
-
177
-
178
-
179
-
180
-
181
-
182
-
183
-
184
-
185
-
186
-
187
-
188
-
189
-
190
-
191
-
192
-
193
-
194
-
195
-
196
-
197
-
198
-
199
-
200
-
201
-
202
-
203
-
204
-
205
-
206
-
207
-
208
-
209
-
210
-
211
-
212
-
213
-
214
-
 215
215 -
 216
216 -
 217
217 -
 218
218 -
 219
219 -
 220
220 -
 221
221 -
 222
222 -
 223
223 -
 224
224 -
 225
225 -
 226
226 -
 227
227 -
 228
228 -
 229
229 -
 230
230 -
 231
231 -
 232
232 -
 233
233 -
 234
234 -
 235
235 -
236
-
237
-
238
-
239
-
240
-
241
-
242
-
243
-
244
-
245
-
246
-
247
-
248
-
249
-
250
-
251
-
252
-
253
-
254
-
255
-
256
-
257
-
258
-
259
-
260
-
261
-
262
-
263
-
264
-
265
-
266
-
267
-
268
-
269
-
270
-
271
-
272
-
273
-
274
-
275
-
276
-
277
-
278
-
279
-
280
-
281
-
282
-
283
-
284
-
285
-
286
-
287
-
288
-
289
-
290
-
291
-
292
-
293
-
294
-
295
-
296
-
297
 |
 |
NOTES TO THE CONSOLIDATED FINANCIAL STATEMENTS
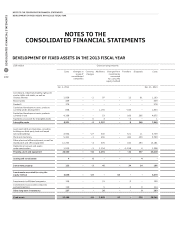
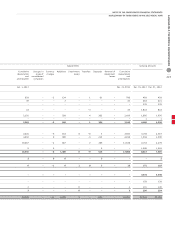
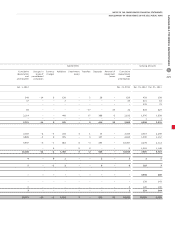
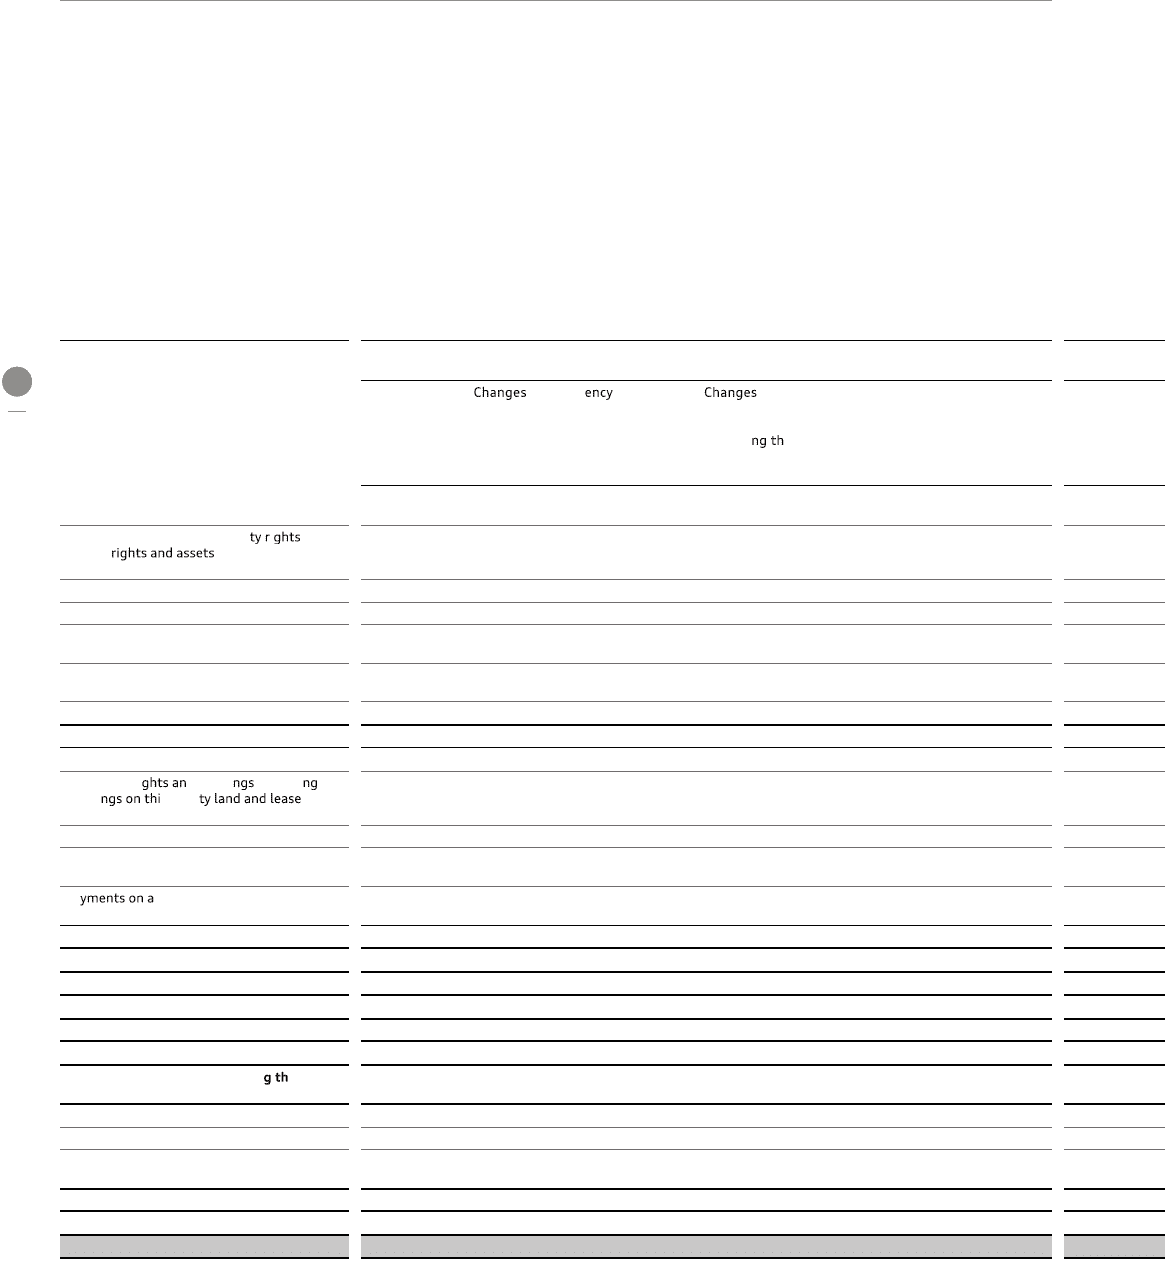
DEVELOPMENT OF FIXED ASSETS IN THE 2013 FISCAL YEAR
CONSOLIDATED FINANCIAL STATEMENTS
222
B
DEVELOPMENT OF FIXED ASSETS IN THE 2013 FISCAL YEAR
EUR million
Gross carrying amounts
Costs in
scope of
consolidated
companies
Curr
changes
Additions from
investments
accounted
for usi e
equity method
Transfers Disposals Costs
Jan. 1, 2013 Dec. 31, 2013
Concessions, industrial proper iand
similar , as well as
licenses thereto 1,058 – – 2 97 –12 61 1,103
Brand names 459 – – – – – – 459
Goodwill 378 – – – – – – 378
Capitalized development costs, products
currently under development 858 – – 1,155 – – 160 – 1,853
Capitalized development costs, products
currently in use 4,168 – – 53 –160 305 4,075
Payments on account for intangible assets 1 – 0 3 – – 3 – 1
Intangible assets 6,921 – –2 1,307 –8 366 7,869
Land, land ri d buildi , includi
buildi rd-par d
land and buildings 4,954 – – 27 302 –521 11 5,739
Plant and machinery 5,322 – – 1 265 –432 229 5,790
Other plant and office equipment, as well as
leased plant and office equipment 12,745 – – 4 570 –162 293 13,181
Pa ccount and assets
under construction 1,519 – – 3 1,154 – – 1,158 4 1,508
Property, plant and equipment 24,540 – –34 2,291 – – 42 537 26,218
Leasing and rental assets 4 – 0 – – – 4 –
Investment property 125 – –3 45 –34 14 186
Investments accounted for usin e
equity method 3,638 – –23 –63 – – 3,678
Investments in affiliated companies 128 – – 31 –0 – 159
Investments in associated companies
and participations 129 – – 5 – 0 0 134
Other long-term investments 257 – – 36 –– 0 293
Fixed assets 35,486 – –62 3,680 63 – 922 38,245
NOTES TO THE
CONSOLIDATED FINANCIAL STATEMENTS