Audi 2013 Annual Report Download - page 178
Download and view the complete annual report
Please find page 178 of the 2013 Audi annual report below. You can navigate through the pages in the report by either clicking on the pages listed below, or by using the keyword search tool below to find specific information within the annual report.-
 1
1 -
2
-
3
-
4
-
5
-
6
-
7
-
8
-
9
-
10
-
11
-
12
-
13
-
14
-
15
-
16
-
17
-
18
-
19
-
20
-
21
-
22
-
23
-
24
-
25
-
26
-
27
-
28
-
29
-
30
-
31
-
32
-
33
-
34
-
35
-
36
-
37
-
38
-
39
-
40
-
41
-
42
-
43
-
44
-
45
-
46
-
47
-
48
-
49
-
50
-
51
-
52
-
53
-
54
-
55
-
56
-
57
-
58
-
59
-
60
-
61
-
62
-
63
-
64
-
65
-
66
-
67
-
68
-
69
-
70
-
71
-
72
-
73
-
74
-
75
-
76
-
77
-
78
-
79
-
80
-
81
-
82
-
83
-
84
-
85
-
86
-
87
-
88
-
89
-
90
-
91
-
92
-
93
-
94
-
95
-
96
-
97
-
98
-
99
-
100
-
101
-
102
-
103
-
104
-
105
-
106
-
107
-
108
-
109
-
110
-
111
-
112
-
113
-
114
-
115
-
116
-
117
-
118
-
119
-
120
-
121
-
122
-
123
-
124
-
125
-
126
-
127
-
128
-
129
-
130
-
131
-
132
-
133
-
134
-
135
-
136
-
137
-
138
-
139
-
140
-
141
-
142
-
143
-
144
-
145
-
146
-
147
-
148
-
149
-
150
-
151
-
152
-
153
-
154
-
155
-
156
-
157
-
158
-
159
-
160
-
161
-
162
-
163
-
164
-
165
-
166
-
167
-
 168
168 -
 169
169 -
 170
170 -
 171
171 -
 172
172 -
 173
173 -
 174
174 -
 175
175 -
 176
176 -
 177
177 -
 178
178 -
 179
179 -
 180
180 -
 181
181 -
 182
182 -
 183
183 -
 184
184 -
 185
185 -
 186
186 -
 187
187 -
 188
188 -
189
-
190
-
191
-
192
-
193
-
194
-
195
-
196
-
197
-
198
-
199
-
200
-
201
-
202
-
203
-
204
-
205
-
206
-
207
-
208
-
209
-
210
-
211
-
212
-
213
-
214
-
215
-
216
-
217
-
218
-
219
-
220
-
221
-
222
-
223
-
224
-
225
-
226
-
227
-
228
-
229
-
230
-
231
-
232
-
233
-
234
-
235
-
236
-
237
-
238
-
239
-
240
-
241
-
242
-
243
-
244
-
245
-
246
-
247
-
248
-
249
-
250
-
251
-
252
-
253
-
254
-
255
-
256
-
257
-
258
-
259
-
260
-
261
-
262
-
263
-
264
-
265
-
266
-
267
-
268
-
269
-
270
-
271
-
272
-
273
-
274
-
275
-
276
-
277
-
278
-
279
-
280
-
281
-
282
-
283
-
284
-
285
-
286
-
287
-
288
-
289
-
290
-
291
-
292
-
293
-
294
-
295
-
296
-
297
 |
 |
FINANCIAL PERFORMANCE INDICATORS
NET WORTH
MANAGEMENT REPORT
175
A
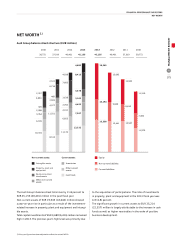
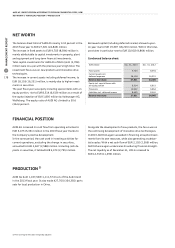
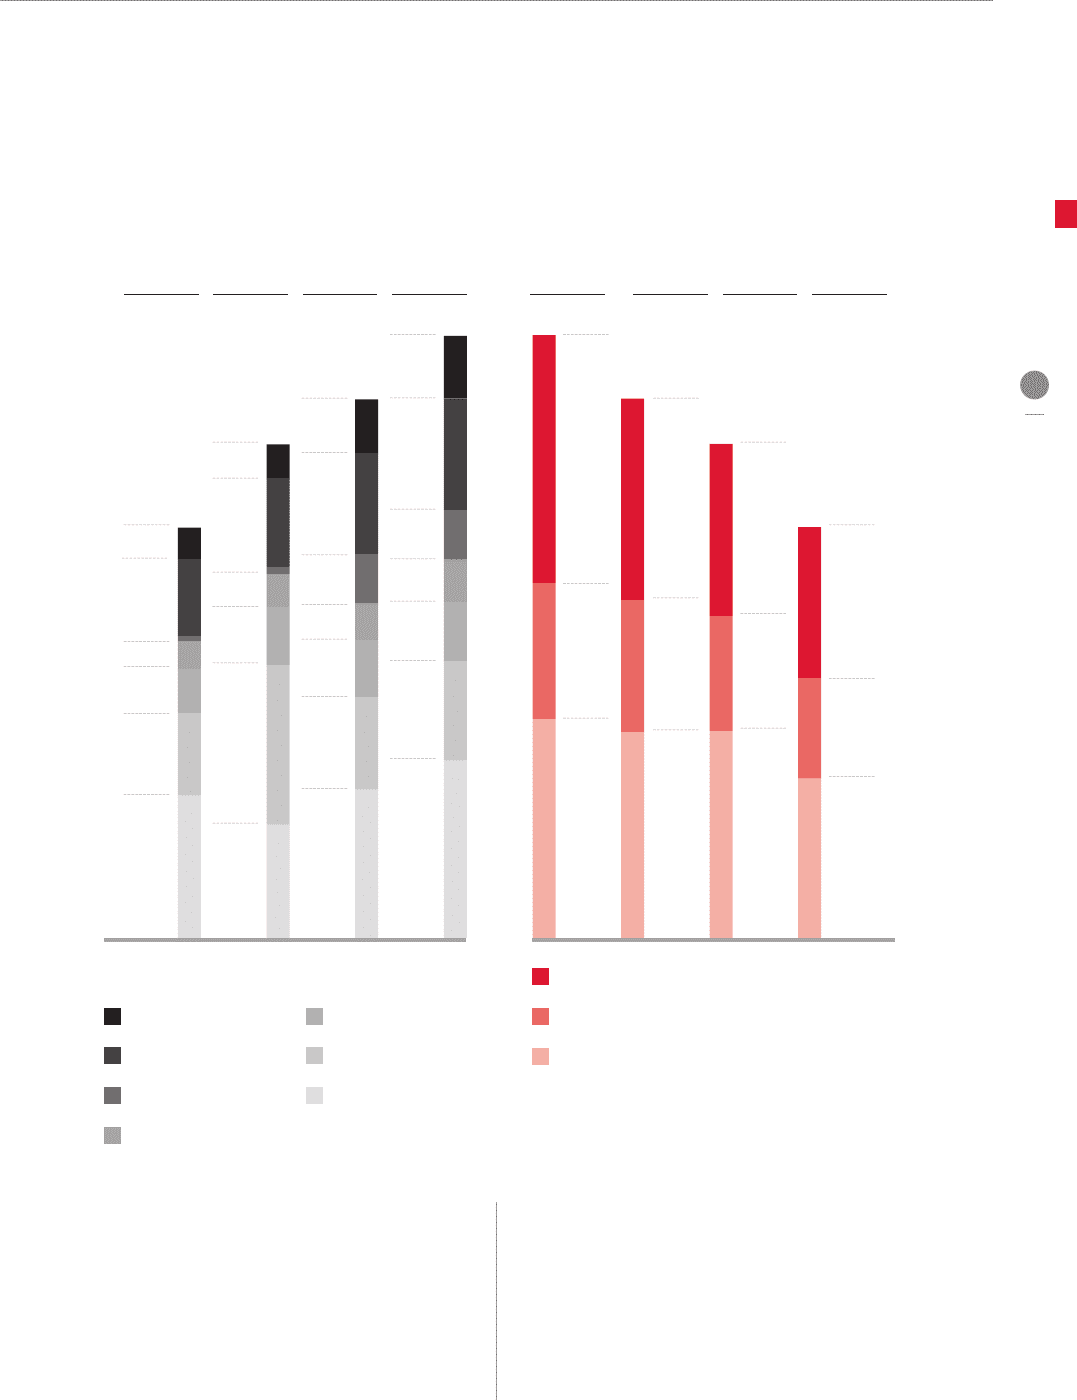
NET WORTH 1)
Audi Group balance sheet structure (EUR million)
The Audi Group’s balance sheet total rose by 11.8 percent to
EUR 45,156 (40,401) million in the past fiscal year.
Non-current assets of EUR 19,943 (18,044) million showed
a year-on-year rise in particular as a result of the investment-
related increase in property, plant and equipment and intangi-
ble assets.
Total capital investments of EUR 3,680 (6,416) million remained
high in 2013. The previous year’s high level was primarily due
to the acquisition of participations. The ratio of investments
in property, plant and equipment in the 2013 fiscal year was
4.8 (4.8) percent.
The significant growth in current assets to EUR 25,214
(22,357) million is largely attributable to the increase in cash
funds as well as higher receivables in the wake of positive
business development.
2013
45,156
2011
37,019
2010
30,772
2012
40,401
13,332
7,387
4,495
4,689
8,513
11,921
4,377
2,531
2,502 3,163
16,398
2010
30,772
2012
40,401
2013
45,156
2011
37,019
10,194
18,565
15,441
9,869
15,092
15,507
8,610
12,903
11,979
7,484
11,310
10,724
6,109
3,354
5,803
2,098
2,357
6,716
460
11,170
6,855
4,331
4,038
2,762
3,638
3,678
7,605
8,413
326
Current assets:
Other non-current
assets
Equity-accounted
investments
Non-current assets:
Cash funds
Inventories
Other current
assets
Non-current liabilities
Current liabilities
Equity
Property, plant and
equipment
Intangible assets
1) Prior-year figures have been adjusted to reflect the revised IAS 19.