Audi 2013 Annual Report Download - page 247
Download and view the complete annual report
Please find page 247 of the 2013 Audi annual report below. You can navigate through the pages in the report by either clicking on the pages listed below, or by using the keyword search tool below to find specific information within the annual report.-
 1
1 -
2
-
3
-
4
-
5
-
6
-
7
-
8
-
9
-
10
-
11
-
12
-
13
-
14
-
15
-
16
-
17
-
18
-
19
-
20
-
21
-
22
-
23
-
24
-
25
-
26
-
27
-
28
-
29
-
30
-
31
-
32
-
33
-
34
-
35
-
36
-
37
-
38
-
39
-
40
-
41
-
42
-
43
-
44
-
45
-
46
-
47
-
48
-
49
-
50
-
51
-
52
-
53
-
54
-
55
-
56
-
57
-
58
-
59
-
60
-
61
-
62
-
63
-
64
-
65
-
66
-
67
-
68
-
69
-
70
-
71
-
72
-
73
-
74
-
75
-
76
-
77
-
78
-
79
-
80
-
81
-
82
-
83
-
84
-
85
-
86
-
87
-
88
-
89
-
90
-
91
-
92
-
93
-
94
-
95
-
96
-
97
-
98
-
99
-
100
-
101
-
102
-
103
-
104
-
105
-
106
-
107
-
108
-
109
-
110
-
111
-
112
-
113
-
114
-
115
-
116
-
117
-
118
-
119
-
120
-
121
-
122
-
123
-
124
-
125
-
126
-
127
-
128
-
129
-
130
-
131
-
132
-
133
-
134
-
135
-
136
-
137
-
138
-
139
-
140
-
141
-
142
-
143
-
144
-
145
-
146
-
147
-
148
-
149
-
150
-
151
-
152
-
153
-
154
-
155
-
156
-
157
-
158
-
159
-
160
-
161
-
162
-
163
-
164
-
165
-
166
-
167
-
168
-
169
-
170
-
171
-
172
-
173
-
174
-
175
-
176
-
177
-
178
-
179
-
180
-
181
-
182
-
183
-
184
-
185
-
186
-
187
-
188
-
189
-
190
-
191
-
192
-
193
-
194
-
195
-
196
-
197
-
198
-
199
-
200
-
201
-
202
-
203
-
204
-
205
-
206
-
207
-
208
-
209
-
210
-
211
-
212
-
213
-
214
-
215
-
216
-
217
-
218
-
219
-
220
-
221
-
222
-
223
-
224
-
225
-
226
-
227
-
228
-
229
-
230
-
231
-
232
-
233
-
234
-
235
-
236
-
 237
237 -
 238
238 -
 239
239 -
 240
240 -
 241
241 -
 242
242 -
 243
243 -
 244
244 -
 245
245 -
 246
246 -
 247
247 -
 248
248 -
 249
249 -
 250
250 -
 251
251 -
 252
252 -
 253
253 -
 254
254 -
 255
255 -
 256
256 -
 257
257 -
258
-
259
-
260
-
261
-
262
-
263
-
264
-
265
-
266
-
267
-
268
-
269
-
270
-
271
-
272
-
273
-
274
-
275
-
276
-
277
-
278
-
279
-
280
-
281
-
282
-
283
-
284
-
285
-
286
-
287
-
288
-
289
-
290
-
291
-
292
-
293
-
294
-
295
-
296
-
297
 |
 |
NOTES TO THE CONSOLIDATED FINANCIAL STATEMENTS
NOTES TO THE INCOME STATEMENT
CONSOLIDATED FINANCIAL STATEMENTS
244
B
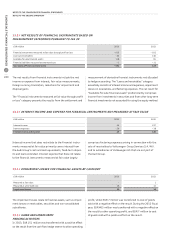
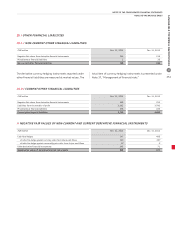
13.2 /
NET RESULTS OF FINANCIAL INSTRUMENTS BASED ON
MEASUREMENT CATEGORIES PURSUANT TO IAS 39
EUR million
2013 2012
Financial instruments measured at fair value through profit or loss –615 –102
Loans and receivables –54 146
Available-for-sale financial assets 118 81
Financial liabilities measured at amortized cost –1 –11
Net results of financial instruments –552 115
The net results from financial instruments include the net
income or expense from interest, fair value measurements,
foreign currency translation, reductions for impairment and
disposal gains.
The “Financial instruments measured at fair value through profit
or loss” category presents the results from the settlement and
measurement of derivative financial instruments not allocated
to hedge accounting. The “Loans and receivables” category
essentially consists of interest income and expenses, impairment
losses on receivables, and factoring expenses. The net result for
“Available-for-sale financial assets” predominantly comprises
income from investments in securities and from other long-term
financial investments not accounted for using the equity method.
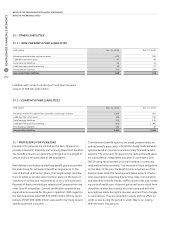
13.3 /
INTEREST INCOME AND EXPENSE FOR FINANCIAL INSTRUMENTS NOT MEASURED AT FAIR VALUE
EUR million
2013 2012
Interest income 54 157
Interest expenses –26 –38
Interest income and expense 27 120
Interest income that does not relate to the financial instru-
ments measured at fair value primarily covers interest from
the Audi Group’s cash and cash equivalents, fixed-term depos-
its and loans extended. Interest expense that does not relate
to the financial instruments measured at fair value largely
comprises factoring expenses arising in connection with the
sale of receivables to Volkswagen Group Services S.A./N.V.
and to subsidiaries of Volkswagen AG that are not part of
the Audi Group.
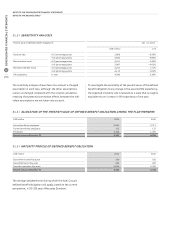
13.4 /
IMPAIRMENT LOSSES FOR FINANCIAL ASSETS BY CATEGORY
EUR million
2013 2012
Measured at fair value – 1
Measured at amortized cost 16 13
Impairment losses 16 14
The impairment losses relate to financial assets, such as impair-
ment losses on receivables, securities and non-consolidated
subsidiaries.
13.5 /
GAINS AND LOSSES FROM
HEDGING ACTIVITIES
In 2013, EUR 151 million was transferred with a positive effect
on the result from the cash flow hedge reserve to other operating
profit, whilst EUR 7 million was transferred to cost of goods
sold with a negative effect on the result. During the 2012 fiscal
year, EUR 463 million was transferred with a negative effect on
the result to other operating profit, and EUR 7 million to cost
of goods sold with a positive effect on the result.