Audi 2013 Annual Report Download - page 179
Download and view the complete annual report
Please find page 179 of the 2013 Audi annual report below. You can navigate through the pages in the report by either clicking on the pages listed below, or by using the keyword search tool below to find specific information within the annual report.-
 1
1 -
2
-
3
-
4
-
5
-
6
-
7
-
8
-
9
-
10
-
11
-
12
-
13
-
14
-
15
-
16
-
17
-
18
-
19
-
20
-
21
-
22
-
23
-
24
-
25
-
26
-
27
-
28
-
29
-
30
-
31
-
32
-
33
-
34
-
35
-
36
-
37
-
38
-
39
-
40
-
41
-
42
-
43
-
44
-
45
-
46
-
47
-
48
-
49
-
50
-
51
-
52
-
53
-
54
-
55
-
56
-
57
-
58
-
59
-
60
-
61
-
62
-
63
-
64
-
65
-
66
-
67
-
68
-
69
-
70
-
71
-
72
-
73
-
74
-
75
-
76
-
77
-
78
-
79
-
80
-
81
-
82
-
83
-
84
-
85
-
86
-
87
-
88
-
89
-
90
-
91
-
92
-
93
-
94
-
95
-
96
-
97
-
98
-
99
-
100
-
101
-
102
-
103
-
104
-
105
-
106
-
107
-
108
-
109
-
110
-
111
-
112
-
113
-
114
-
115
-
116
-
117
-
118
-
119
-
120
-
121
-
122
-
123
-
124
-
125
-
126
-
127
-
128
-
129
-
130
-
131
-
132
-
133
-
134
-
135
-
136
-
137
-
138
-
139
-
140
-
141
-
142
-
143
-
144
-
145
-
146
-
147
-
148
-
149
-
150
-
151
-
152
-
153
-
154
-
155
-
156
-
157
-
158
-
159
-
160
-
161
-
162
-
163
-
164
-
165
-
166
-
167
-
168
-
 169
169 -
 170
170 -
 171
171 -
 172
172 -
 173
173 -
 174
174 -
 175
175 -
 176
176 -
 177
177 -
 178
178 -
 179
179 -
 180
180 -
 181
181 -
 182
182 -
 183
183 -
 184
184 -
 185
185 -
 186
186 -
 187
187 -
 188
188 -
 189
189 -
190
-
191
-
192
-
193
-
194
-
195
-
196
-
197
-
198
-
199
-
200
-
201
-
202
-
203
-
204
-
205
-
206
-
207
-
208
-
209
-
210
-
211
-
212
-
213
-
214
-
215
-
216
-
217
-
218
-
219
-
220
-
221
-
222
-
223
-
224
-
225
-
226
-
227
-
228
-
229
-
230
-
231
-
232
-
233
-
234
-
235
-
236
-
237
-
238
-
239
-
240
-
241
-
242
-
243
-
244
-
245
-
246
-
247
-
248
-
249
-
250
-
251
-
252
-
253
-
254
-
255
-
256
-
257
-
258
-
259
-
260
-
261
-
262
-
263
-
264
-
265
-
266
-
267
-
268
-
269
-
270
-
271
-
272
-
273
-
274
-
275
-
276
-
277
-
278
-
279
-
280
-
281
-
282
-
283
-
284
-
285
-
286
-
287
-
288
-
289
-
290
-
291
-
292
-
293
-
294
-
295
-
296
-
297
 |
 |

FINANCIAL PERFORMANCE INDICATORS
NET WORTH // FINANCIAL POSITION
MANAGEMENT REPORT
176
A
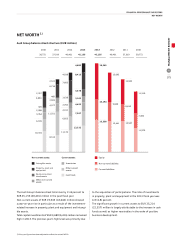
The equity of the Audi Group rose to EUR 18,565 (15,092)
million as of December 31, 2013. The main factor behind
this increase was the cash injection of EUR 1,895 million by
Volkswagen AG, Wolfsburg, into the capital reserve of AUDI AG.
The allocation to the retained earnings of the balance remain-
ing after the transfer of profit increased equity by a further
EUR 779 million. The equity ratio of the Audi Group consequently
climbed to 41.1 (37.4) percent as of the balance sheet date.
Non-current liabilities were slightly higher than in the previous
year at EUR 10,194 (9,869) million. Lower provisions for pen-
sions attributable to interest rate factors contrasted in particular
with higher obligations from sales operations as a result of the
increased volume.
Current liabilities of EUR 16,398 (15,441) million showed
an increase on the prior-year figure above all due to higher
trade payables.
FINANCIAL POSITION 1)
We increased the cash flow from operating activities to
EUR 6,778 (6,144) million in the past fiscal year. Disregarding
the change in participations, the cash used in investing activ-
ities for current operations rose to EUR 3,553 (3,237) million
over the same period. Of the total investments in property,
plant and equipment and intangible assets, the Automotive
segment accounted for EUR 3,544 (3,227) million and the
Motorcycles segment for EUR 50 (30) million. The focus of
capital investments by the Audi Group was on the expansion of
our international production network as well on new products
and pioneering drive technologies. The changes in participations
resulted in an additional cash outflow of EUR 36 (3,567) million.
Overall the cash flow from investing activities, taking account
of changes in cash deposits and loans extended, came to
EUR 2,674 (4,896) million. The net cash flow amounted to
EUR 3,189 (– 660) million last fiscal year. Disregarding changes
in participations, net cash flow increased to EUR 3,225 (2,907)
million. As in previous years, all investments in operating
activities were therefore financed entirely from own resources.
In addition, we generated a healthy surplus.
Net liquidity was increased to the year-end figure of EUR 14,716
(13,396) million. This sum includes an amount of EUR 69 (75)
million serving as security for the independent dealers financed
by Volkswagen Bank GmbH, Braunschweig. Furthermore, the
Audi Group has adequate committed but currently unused
external credit lines.
As of December 31, 2013, other financial obligations, which
largely comprise ordering commitments, amounted to
EUR 3,736 (3,002) million. Further details are given in
Section 42 of the Notes: “Other financial obligations.”
The principles of financial management are explained
in the strategy goal “Superior financial strength”
on page 149.
1) Prior-year figures have been adjusted to reflect the revised IAS 19.