The Hartford 2012 Annual Report Download - page 89
Download and view the complete annual report
Please find page 89 of the 2012 The Hartford annual report below. You can navigate through the pages in the report by either clicking on the pages listed below, or by using the keyword search tool below to find specific information within the annual report.-
 1
1 -
2
-
3
-
4
-
5
-
6
-
7
-
8
-
9
-
10
-
11
-
12
-
13
-
14
-
15
-
16
-
17
-
18
-
19
-
20
-
21
-
22
-
23
-
24
-
25
-
26
-
27
-
28
-
29
-
30
-
31
-
32
-
33
-
34
-
35
-
36
-
37
-
38
-
39
-
40
-
41
-
42
-
43
-
44
-
45
-
46
-
47
-
48
-
49
-
50
-
51
-
52
-
53
-
54
-
55
-
56
-
57
-
58
-
59
-
60
-
61
-
62
-
63
-
64
-
65
-
66
-
67
-
68
-
69
-
70
-
71
-
72
-
73
-
74
-
75
-
76
-
77
-
78
-
 79
79 -
 80
80 -
 81
81 -
 82
82 -
 83
83 -
 84
84 -
 85
85 -
 86
86 -
 87
87 -
 88
88 -
 89
89 -
 90
90 -
 91
91 -
 92
92 -
 93
93 -
 94
94 -
 95
95 -
 96
96 -
 97
97 -
 98
98 -
 99
99 -
100
-
101
-
102
-
103
-
104
-
105
-
106
-
107
-
108
-
109
-
110
-
111
-
112
-
113
-
114
-
115
-
116
-
117
-
118
-
119
-
120
-
121
-
122
-
123
-
124
-
125
-
126
-
127
-
128
-
129
-
130
-
131
-
132
-
133
-
134
-
135
-
136
-
137
-
138
-
139
-
140
-
141
-
142
-
143
-
144
-
145
-
146
-
147
-
148
-
149
-
150
-
151
-
152
-
153
-
154
-
155
-
156
-
157
-
158
-
159
-
160
-
161
-
162
-
163
-
164
-
165
-
166
-
167
-
168
-
169
-
170
-
171
-
172
-
173
-
174
-
175
-
176
-
177
-
178
-
179
-
180
-
181
-
182
-
183
-
184
-
185
-
186
-
187
-
188
-
189
-
190
-
191
-
192
-
193
-
194
-
195
-
196
-
197
-
198
-
199
-
200
-
201
-
202
-
203
-
204
-
205
-
206
-
207
-
208
-
209
-
210
-
211
-
212
-
213
-
214
-
215
-
216
-
217
-
218
-
219
-
220
-
221
-
222
-
223
-
224
-
225
-
226
-
227
-
228
-
229
-
230
-
231
-
232
-
233
-
234
-
235
-
236
-
237
-
238
-
239
-
240
-
241
-
242
-
243
-
244
-
245
-
246
-
247
-
248
-
249
-
250
-
251
-
252
-
253
-
254
-
255
-
256
-
257
-
258
-
259
-
260
-
261
-
262
-
263
-
264
-
265
-
266
-
267
-
268
-
269
-
270
-
271
-
272
-
273
-
274
-
275
-
276
-
277
-
278
-
279
-
280
-
281
-
282
-
283
-
284
-
285
-
286
-
287
-
288
-
289
-
290
-
291
-
292
-
293
-
294
-
295
-
296
-
297
-
298
-
299
-
300
-
301
-
302
-
303
-
304
-
305
-
306
-
307
-
308
-
309
-
310
-
311
-
312
-
313
-
314
-
315
-
316
-
317
-
318
-
319
-
320
-
321
-
322
-
323
-
324
-
325
-
326
-
327
-
328
-
329
-
330
-
331
-
332
-
333
-
334
-
335
 |
 |

Table of Contents
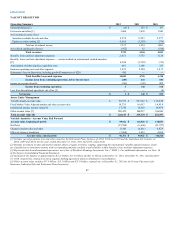
In the fourth quarter of 2012, the Company made changes to its reporting segments to reflect the manner in which it is currently organized for purposes of
making operating decisions and assessing performance. The Talcott Resolution (formerly Life Other Operations) Operating Summary currently includes the
operating results of the Retirement Plans and Individual Life businesses that were sold in January 2013. For further discussion of these transactions, see Note
2 - Business Dispositions of the Notes to Consolidated Financial Statements.
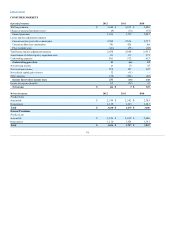
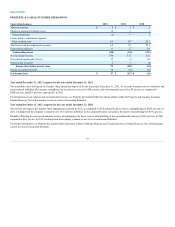
Year ended December 31, 2012 compared to the year ended December 31, 2011
Net income, as compared to the prior year period, decreased for the year ended December 31, 2012 primarily due to net realized capital losses as compared to
net realized capital gains in the prior period and the estimated reinsurance loss on disposition of the Individual Life business, including an after tax goodwill
impairment charge of $146. The estimate is subject to change pending final determination of net assets sold, transaction costs, and other adjustments.
Restructuring costs of $44, after-tax in 2012 also contributed to the decrease in net income as compared to the prior year period as there were no restructuring
costs in 2011. An Unlock benefit in 2012 partially offset the decrease in net income as compared to the prior year period. In addition, benefits, losses and loss
adjustment expenses, decreased as compared to the prior year period, reflecting an improvement in equity market performance. For related discussion of the
goodwill impairment, see MD&A – Critical Accounting Estimates, MD&A - Corporate and Note 9 - Goodwill and Other Intangible Assets of Notes to
Consolidated Financial Statements. For further discussion of the reinsurance loss on disposition, see Note 2 - Business Dispositions of Notes to Consolidated
Financial Statements.
Net income of the Retirement Plans business decreased, as compared to the prior year, to a net loss of $39 in 2012 from net income of $3 in 2011 primarily
due to an increase in net realized capital losses and restructuring costs of $14, after-tax in 2012 associated with the sale of the business. Net income (loss) of
the Individual Life business decreased, as compared to the prior year, to a net loss of $172 in 2012 from net income of $114 in 2011 primarily due to the
reinsurance loss on disposition, including an after tax goodwill impairment charge of $146, unfavorable mortality, and restructuring costs of $25, after-tax in
2012 associated with the sale of the business.
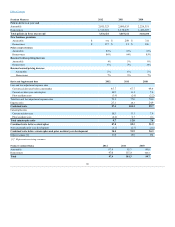
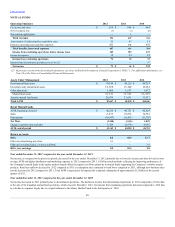
The net increase in realized capital losses was primarily due to losses in the variable annuity hedge program. Variable annuity hedge program losses for the
year ended December 31, 2012 were $ 1,311 including international losses of $1,490, compared to gains of $162, including international gains of $775 for
the prior year period. Net realized capital losses in 2012 also include intent-to-sell impairment losses of $177 related to the sales in January 2013 of the
Retirement Plans and Individual Life businesses. Total net impairment losses, including intent-to-sell impairment losses, increased to $247 in 2012 as
compared to $117 for the prior year period. For further discussion of investment results and the results of the variable annuity hedge program, see MD&A –
Investment Results, Net Investment Income (Loss) and Net Realized Capital Gains (Losses) within Key Performance Measures and Ratios.
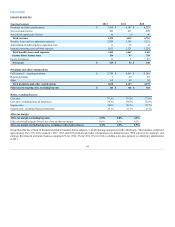
Talcott Resolution's effective tax rate for 2012 differs from the statutory rate of 35% primarily due to permanent differences for separate account DRD. For
further discussion of income taxes, see Note 14 of the Notes to Consolidated Financial Statements.
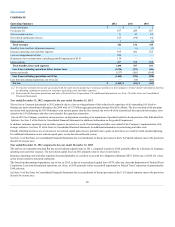
Account values for Talcott Resolution decreased to approximately $228 billion at December 31, 2012 from approximately $235 billion at December 31, 2011,
due primarily to surrenders of approximately $10 billion in 2012 in the U.S. variable annuity block, largely offset by the impact of improved equity market
performance. In 2012, the annualized full surrender rate on U.S. variable annuities rose to 10.9% compared to 9.3% in 2011 and the annualized full surrender
rate on Japan variable annuities rose to 3.4% in 2012 from 2.6% in 2011.
The Company expects annuity account values and consequently earnings to continue to decline over time as fee income decreases due to surrenders,
policyholder initiatives or potential transactions with third parties that will reduce the size of the related book of business. In addition, as the Individual Life
and Retirement Plans sale transactions were structured as reinsurance transactions, account values associated with these businesses will no longer generate
asset-based fee income following the January 2013 closings.
Year ended December 31, 2011 compared to the year ended December 31, 2010
Net income, as compared to the prior year period, decreased for December 31, 2011 primarily due to an Unlock charge in 2011 as compared to an Unlock
benefit in 2010, partially offset by net realized capital gains in 2011 as compared to net realized capital losses in the prior year period. Benefits, losses and loss
adjustment expenses increased in 2011 reflecting the decline in equity market performance however, these expenses were partially offset by the release of a
reserve related to a Japan product. In addition, insurance operating costs and other expenses increased in 2011 due to costs associated with expected
assessments related to the Executive Life Insurance Company of New York (“ELNY”) insolvency. Net income of the Retirement Plans business decreased, as
compared to the prior year, to $3 in 2011 from $6 in 2010. Net income of the Individual Life business decreased, as compared to the prior year, to $114 in
2011 from $198 in 2010. For further discussion of the Unlock see MD&A – Critical Accounting Estimates.
The net realized capital gains in 2011 compared to net realized capital losses in 2010 were primarily due to gains in the variable annuity hedge program and
lower net impairment losses. Variable annuity hedge program gains were $162 in 2011 compared to losses of $345 in 2010. For further discussion of
investment results and the results of the variable annuity hedge program see MD&A - Investment Results, Net Investment Income (Loss) and Net Realized
Capital Gains (Losses) within Key Performance Measures and Ratios.
88