The Hartford 2012 Annual Report Download - page 130
Download and view the complete annual report
Please find page 130 of the 2012 The Hartford annual report below. You can navigate through the pages in the report by either clicking on the pages listed below, or by using the keyword search tool below to find specific information within the annual report.-
 1
1 -
2
-
3
-
4
-
5
-
6
-
7
-
8
-
9
-
10
-
11
-
12
-
13
-
14
-
15
-
16
-
17
-
18
-
19
-
20
-
21
-
22
-
23
-
24
-
25
-
26
-
27
-
28
-
29
-
30
-
31
-
32
-
33
-
34
-
35
-
36
-
37
-
38
-
39
-
40
-
41
-
42
-
43
-
44
-
45
-
46
-
47
-
48
-
49
-
50
-
51
-
52
-
53
-
54
-
55
-
56
-
57
-
58
-
59
-
60
-
61
-
62
-
63
-
64
-
65
-
66
-
67
-
68
-
69
-
70
-
71
-
72
-
73
-
74
-
75
-
76
-
77
-
78
-
79
-
80
-
81
-
82
-
83
-
84
-
85
-
86
-
87
-
88
-
89
-
90
-
91
-
92
-
93
-
94
-
95
-
96
-
97
-
98
-
99
-
100
-
101
-
102
-
103
-
104
-
105
-
106
-
107
-
108
-
109
-
110
-
111
-
112
-
113
-
114
-
115
-
116
-
117
-
118
-
119
-
 120
120 -
 121
121 -
 122
122 -
 123
123 -
 124
124 -
 125
125 -
 126
126 -
 127
127 -
 128
128 -
 129
129 -
 130
130 -
 131
131 -
 132
132 -
 133
133 -
 134
134 -
 135
135 -
 136
136 -
 137
137 -
 138
138 -
 139
139 -
 140
140 -
141
-
142
-
143
-
144
-
145
-
146
-
147
-
148
-
149
-
150
-
151
-
152
-
153
-
154
-
155
-
156
-
157
-
158
-
159
-
160
-
161
-
162
-
163
-
164
-
165
-
166
-
167
-
168
-
169
-
170
-
171
-
172
-
173
-
174
-
175
-
176
-
177
-
178
-
179
-
180
-
181
-
182
-
183
-
184
-
185
-
186
-
187
-
188
-
189
-
190
-
191
-
192
-
193
-
194
-
195
-
196
-
197
-
198
-
199
-
200
-
201
-
202
-
203
-
204
-
205
-
206
-
207
-
208
-
209
-
210
-
211
-
212
-
213
-
214
-
215
-
216
-
217
-
218
-
219
-
220
-
221
-
222
-
223
-
224
-
225
-
226
-
227
-
228
-
229
-
230
-
231
-
232
-
233
-
234
-
235
-
236
-
237
-
238
-
239
-
240
-
241
-
242
-
243
-
244
-
245
-
246
-
247
-
248
-
249
-
250
-
251
-
252
-
253
-
254
-
255
-
256
-
257
-
258
-
259
-
260
-
261
-
262
-
263
-
264
-
265
-
266
-
267
-
268
-
269
-
270
-
271
-
272
-
273
-
274
-
275
-
276
-
277
-
278
-
279
-
280
-
281
-
282
-
283
-
284
-
285
-
286
-
287
-
288
-
289
-
290
-
291
-
292
-
293
-
294
-
295
-
296
-
297
-
298
-
299
-
300
-
301
-
302
-
303
-
304
-
305
-
306
-
307
-
308
-
309
-
310
-
311
-
312
-
313
-
314
-
315
-
316
-
317
-
318
-
319
-
320
-
321
-
322
-
323
-
324
-
325
-
326
-
327
-
328
-
329
-
330
-
331
-
332
-
333
-
334
-
335
 |
 |

Table of Contents
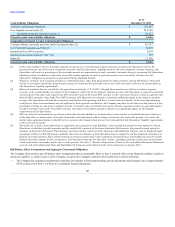
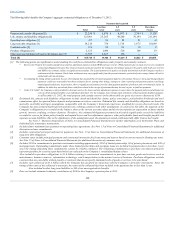
Capitalization
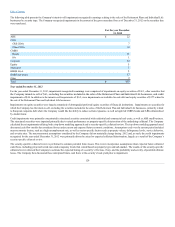
The capital structure of The Hartford as of December 31, 2012 and December 31, 2011 consisted of debt and stockholders’ equity, summarized as follows:
Short-term debt (includes current maturities of long-term debt) $320 $ — — %
Long-term debt 6,806 6,216 9 %
Stockholders’ equity excluding accumulated other comprehensive income (loss), net of tax
(“AOCI”) 19,604 20,235 (3)%
AOCI, net of tax 2,843 1,251 127 %
Debt to stockholders’ equity 32%29%
Debt to capitalization 24%22%
[1] Total debt of the Company excludes $161 and $314 of consumer notes as of December 31, 2012 and December 31, 2011, respectively.
The Hartford’s total capitalization increased $1.9 billion, or 7%, from December 31, 2011 to December 31, 2012 due to increases in total debt and AOCI, net
of tax, partially offset by decreases in stockholders' equity, excluding AOCI. The decrease in stockholders’ equity, excluding AOCI, was primarily due to the
repurchase of outstanding warrants held by Allianz for $300, common and preferred stock dividends declared of $218 and share repurchases of $149.
Total debt increased primarily due to the issuance of $1.55 billion in senior notes and $600 in junior subordinated debentures in April 2012, partially offset
by the repurchase of $1.75 billion in junior subordinated debentures in April 2012.
AOCI, net of tax, improved primarily due to improvements in the Company’s net unrealized position on available-for-sale securities of $1.9 billion primarily
as a result of improved security valuations largely due to credit spread tightening and declining interest rates.
For additional information on debt and the repurchase of warrants, see MD&A – Liquidity Requirements and Sources of Capital and Note 15 and Note 16 of
the Notes to Consolidated Financial Statements. For additional information on equity and AOCI, net of tax, see Notes 16 and 17, respectively, of the Notes to
Consolidated Financial Statements.
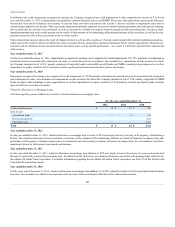
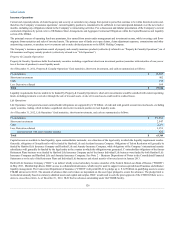
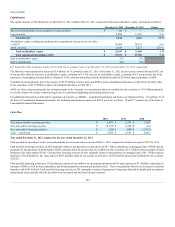
Cash Flow
Net cash provided by operating activities $2,681 $ 2,274 $ 3,309
Net cash used for investing activities $(2,557) $ (1,182) $ (434)
Net cash used for financing activities $(228) $ (609) $ (2,955)
Cash — end of year $ 2,421 $ 2,581 $2,062
Year ended December 31, 2012 compared to the year ended December 31, 2011
Cash provided by operating activities increased primarily due to income taxes received of $486 in 2012, compared to income taxes paid of $179 in 2011.
Cash used for investing activities in 2012 primarily relates to net payments on derivatives of $2.7 billion, purchases of mortgage loans of $968 and net
payments for the purchases of partnerships of $695, partially offset by net proceeds of available-for-sale securities of $1.7 billion and net receipts of fixed
maturities, fair value option of $101. Cash used for investing activities in 2011 primarily relates to net purchases of mortgage loans of $1.3 billion and net
purchases of fixed maturities, fair value option of $627, partially offset by net receipts on derivatives of $720 and net proceeds of available-for-sale securities
of $256.
Cash used for financing activities in 2012 primarily consists of net outflows on investment and universal life-type contracts of $1.4 billion, repurchase of
warrants of $300, as well as share repurchases and dividends paid on common and preferred stock. These were partially offset by net increases in securities
loaned or sold of $1.9 billion. Cash used for financing activities in 2011 primarily consists of repayment of long-term debt and dividends paid on common
and preferred stock, partially offset by net inflows on investment and universal life-type contracts.
129