The Hartford 2012 Annual Report Download - page 230
Download and view the complete annual report
Please find page 230 of the 2012 The Hartford annual report below. You can navigate through the pages in the report by either clicking on the pages listed below, or by using the keyword search tool below to find specific information within the annual report.-
 1
1 -
2
-
3
-
4
-
5
-
6
-
7
-
8
-
9
-
10
-
11
-
12
-
13
-
14
-
15
-
16
-
17
-
18
-
19
-
20
-
21
-
22
-
23
-
24
-
25
-
26
-
27
-
28
-
29
-
30
-
31
-
32
-
33
-
34
-
35
-
36
-
37
-
38
-
39
-
40
-
41
-
42
-
43
-
44
-
45
-
46
-
47
-
48
-
49
-
50
-
51
-
52
-
53
-
54
-
55
-
56
-
57
-
58
-
59
-
60
-
61
-
62
-
63
-
64
-
65
-
66
-
67
-
68
-
69
-
70
-
71
-
72
-
73
-
74
-
75
-
76
-
77
-
78
-
79
-
80
-
81
-
82
-
83
-
84
-
85
-
86
-
87
-
88
-
89
-
90
-
91
-
92
-
93
-
94
-
95
-
96
-
97
-
98
-
99
-
100
-
101
-
102
-
103
-
104
-
105
-
106
-
107
-
108
-
109
-
110
-
111
-
112
-
113
-
114
-
115
-
116
-
117
-
118
-
119
-
120
-
121
-
122
-
123
-
124
-
125
-
126
-
127
-
128
-
129
-
130
-
131
-
132
-
133
-
134
-
135
-
136
-
137
-
138
-
139
-
140
-
141
-
142
-
143
-
144
-
145
-
146
-
147
-
148
-
149
-
150
-
151
-
152
-
153
-
154
-
155
-
156
-
157
-
158
-
159
-
160
-
161
-
162
-
163
-
164
-
165
-
166
-
167
-
168
-
169
-
170
-
171
-
172
-
173
-
174
-
175
-
176
-
177
-
178
-
179
-
180
-
181
-
182
-
183
-
184
-
185
-
186
-
187
-
188
-
189
-
190
-
191
-
192
-
193
-
194
-
195
-
196
-
197
-
198
-
199
-
200
-
201
-
202
-
203
-
204
-
205
-
206
-
207
-
208
-
209
-
210
-
211
-
212
-
213
-
214
-
215
-
216
-
217
-
218
-
219
-
 220
220 -
 221
221 -
 222
222 -
 223
223 -
 224
224 -
 225
225 -
 226
226 -
 227
227 -
 228
228 -
 229
229 -
 230
230 -
 231
231 -
 232
232 -
 233
233 -
 234
234 -
 235
235 -
 236
236 -
 237
237 -
 238
238 -
 239
239 -
 240
240 -
241
-
242
-
243
-
244
-
245
-
246
-
247
-
248
-
249
-
250
-
251
-
252
-
253
-
254
-
255
-
256
-
257
-
258
-
259
-
260
-
261
-
262
-
263
-
264
-
265
-
266
-
267
-
268
-
269
-
270
-
271
-
272
-
273
-
274
-
275
-
276
-
277
-
278
-
279
-
280
-
281
-
282
-
283
-
284
-
285
-
286
-
287
-
288
-
289
-
290
-
291
-
292
-
293
-
294
-
295
-
296
-
297
-
298
-
299
-
300
-
301
-
302
-
303
-
304
-
305
-
306
-
307
-
308
-
309
-
310
-
311
-
312
-
313
-
314
-
315
-
316
-
317
-
318
-
319
-
320
-
321
-
322
-
323
-
324
-
325
-
326
-
327
-
328
-
329
-
330
-
331
-
332
-
333
-
334
-
335
 |
 |

Table of Contents
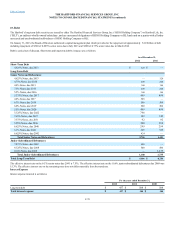
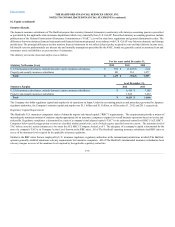
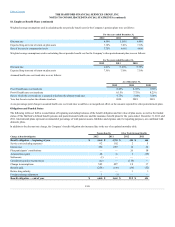
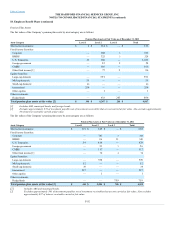
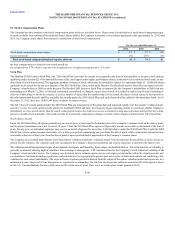
Weighted average assumptions used in calculating the net periodic benefit cost for the Company’s pension plans were as follows:
Discount rate 4.50%5.50%6.00%
Expected long-term rate of return on plan assets 7.30%7.30%7.30%
Rate of increase in compensation levels 3.75%4.00%4.00%
Weighted average assumptions used in calculating the net periodic benefit cost for the Company’s other postretirement plans were as follows:
Discount rate 4.00%5.25%5.75%
Expected long-term rate of return on plan assets 7.30%7.30%7.30%
Assumed health care cost trend rates were as follows:
Pre-65 health care cost trend rate 8.45%8.95%9.70%
Post-65 health care cost trend rate 6.15%7.75%8.25%
Rate to which the cost trend rate is assumed to decline (the ultimate trend rate) 4.75%5.00%5.00%
Year that the rate reaches the ultimate trend rate 2020 2019 2018
A one-percentage point change in assumed health care cost trend rates would have an insignificant effect on the amounts reported for other postretirement plans.
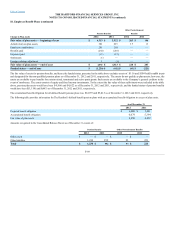
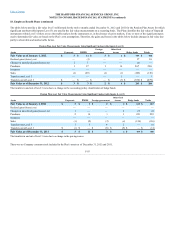
The following tables set forth a reconciliation of beginning and ending balances of the benefit obligation and fair value of plan assets, as well as the funded
status of The Hartford’s defined benefit pension and postretirement health care and life insurance benefit plans for the years ended December 31, 2012 and
2011. International plans represent an immaterial percentage of total pension assets, liabilities and expense and, for reporting purposes, are combined with
domestic plans.
In addition to the discount rate change, the Company’s benefit obligation also increased due to the use of an updated mortality table.
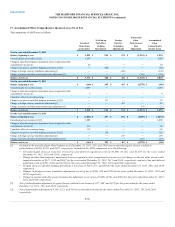
Service cost (excluding expenses) 92 102 2 5
Interest cost 250 259 14 20
Plan participants’ contributions — — 20 18
Actuarial loss (gain) 28 43 1 (15)
Settlements (3) — — —
Curtailment gain due to plan freeze (42) — (116) —
Change in assumptions 545 497 19 37
Benefits paid (256)(230)(54) (52)
Retiree drug subsidy — — 3 3
Foreign exchange adjustment 1(1) — —
F-88