The Hartford 2012 Annual Report Download - page 83
Download and view the complete annual report
Please find page 83 of the 2012 The Hartford annual report below. You can navigate through the pages in the report by either clicking on the pages listed below, or by using the keyword search tool below to find specific information within the annual report.-
 1
1 -
2
-
3
-
4
-
5
-
6
-
7
-
8
-
9
-
10
-
11
-
12
-
13
-
14
-
15
-
16
-
17
-
18
-
19
-
20
-
21
-
22
-
23
-
24
-
25
-
26
-
27
-
28
-
29
-
30
-
31
-
32
-
33
-
34
-
35
-
36
-
37
-
38
-
39
-
40
-
41
-
42
-
43
-
44
-
45
-
46
-
47
-
48
-
49
-
50
-
51
-
52
-
53
-
54
-
55
-
56
-
57
-
58
-
59
-
60
-
61
-
62
-
63
-
64
-
65
-
66
-
67
-
68
-
69
-
70
-
71
-
72
-
 73
73 -
 74
74 -
 75
75 -
 76
76 -
 77
77 -
 78
78 -
 79
79 -
 80
80 -
 81
81 -
 82
82 -
 83
83 -
 84
84 -
 85
85 -
 86
86 -
 87
87 -
 88
88 -
 89
89 -
 90
90 -
 91
91 -
 92
92 -
 93
93 -
94
-
95
-
96
-
97
-
98
-
99
-
100
-
101
-
102
-
103
-
104
-
105
-
106
-
107
-
108
-
109
-
110
-
111
-
112
-
113
-
114
-
115
-
116
-
117
-
118
-
119
-
120
-
121
-
122
-
123
-
124
-
125
-
126
-
127
-
128
-
129
-
130
-
131
-
132
-
133
-
134
-
135
-
136
-
137
-
138
-
139
-
140
-
141
-
142
-
143
-
144
-
145
-
146
-
147
-
148
-
149
-
150
-
151
-
152
-
153
-
154
-
155
-
156
-
157
-
158
-
159
-
160
-
161
-
162
-
163
-
164
-
165
-
166
-
167
-
168
-
169
-
170
-
171
-
172
-
173
-
174
-
175
-
176
-
177
-
178
-
179
-
180
-
181
-
182
-
183
-
184
-
185
-
186
-
187
-
188
-
189
-
190
-
191
-
192
-
193
-
194
-
195
-
196
-
197
-
198
-
199
-
200
-
201
-
202
-
203
-
204
-
205
-
206
-
207
-
208
-
209
-
210
-
211
-
212
-
213
-
214
-
215
-
216
-
217
-
218
-
219
-
220
-
221
-
222
-
223
-
224
-
225
-
226
-
227
-
228
-
229
-
230
-
231
-
232
-
233
-
234
-
235
-
236
-
237
-
238
-
239
-
240
-
241
-
242
-
243
-
244
-
245
-
246
-
247
-
248
-
249
-
250
-
251
-
252
-
253
-
254
-
255
-
256
-
257
-
258
-
259
-
260
-
261
-
262
-
263
-
264
-
265
-
266
-
267
-
268
-
269
-
270
-
271
-
272
-
273
-
274
-
275
-
276
-
277
-
278
-
279
-
280
-
281
-
282
-
283
-
284
-
285
-
286
-
287
-
288
-
289
-
290
-
291
-
292
-
293
-
294
-
295
-
296
-
297
-
298
-
299
-
300
-
301
-
302
-
303
-
304
-
305
-
306
-
307
-
308
-
309
-
310
-
311
-
312
-
313
-
314
-
315
-
316
-
317
-
318
-
319
-
320
-
321
-
322
-
323
-
324
-
325
-
326
-
327
-
328
-
329
-
330
-
331
-
332
-
333
-
334
-
335
 |
 |

Table of Contents
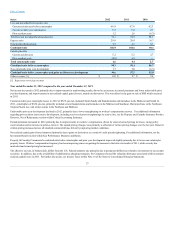
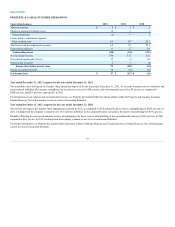
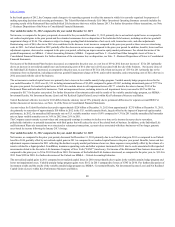
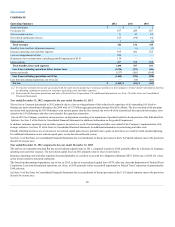
Year ended December 31, 2011 compared to the year ended December 31, 2010
Net income decreased in 2011, as compared to the prior year, due to higher current accident year catastrophes and a $73, after-tax, charge, recorded in other
expenses, related to the write off of capitalized costs associated with a discontinued policy administration software project.
Current accident year catastrophe losses increased from 2010 to 2011, driven by an increase in tornado and thunderstorm losses in the Midwest and Southeast
of approximately $140, pre-tax. In 2011, catastrophes primarily included severe tornadoes, hail and thunderstorm events in the Midwest and Southeast and
Hurricane Irene. In 2010, catastrophes primarily included tornadoes, hail and thunderstorm events in the Midwest, Plains States and the Southeast, as well
as, a severe wind and hail storm event in Arizona.
Earned premiums decreased in auto and were down modestly for homeowners. For both auto and homeowners, non-renewal of existing policies more than
offset the impacts of new business written premium and renewal earned pricing increases. Compared to 2010, the number of policies in-force as of
December 31, 2011 decreased for both auto and home, driven by non-renewals.
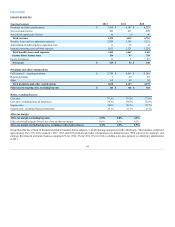
Auto new business written premium decreased, primarily due to the effect of written pricing increases and underwriting actions that lowered the policy issue
rate in Agency. Home new business written premium decreased in both AARP and Agency driven largely by the effect of written pricing increases. While auto
and home new business written premium declined for the full year, new business increased in the latter part of the year with new business growth in both
channels in the fourth quarter of 2011.
The higher auto renewal earned pricing in 2011 was due to rate increases and the effect of policyholders purchasing newer vehicle models in place of older
models. Average renewal earned premium per policy for auto increased modestly as renewal earned pricing increases were partially offset by the effect of a
continued shift to more preferred market business which has lower average earned premium. Homeowners’ renewal earned pricing increases were due to rate
increases and increased coverage amounts. For both auto and home, the Company has increased rates in certain states for certain classes of business to
maintain profitability in the face of rising loss costs.
Current accident year losses and loss adjustment expenses before catastrophes decreased primarily due to lower earned premiums. The overall current accident
year loss and loss adjustment expense ratio before catastrophes decreased during 2011 as a 2.6 point decrease for auto was partially offset by a 1.2 point
increase for home. For auto, the effect of earned pricing increases and lower estimated frequency on auto liability claims was partially offset by higher auto
physical damage severity. For home, an increase in the frequency of non-catastrophe weather claims was partially offset by the effect of earned pricing
increases.
Amortization of deferred acquisition costs decreased largely due to a decline in commissions paid to agents due to lower Agency earned premium. The decrease
in underwriting expenses was primarily driven by a decrease in reserves for other state funds and taxes. The decline in net servicing income in 2011 was
largely due to lower contact center transaction volumes handled as a third party administrator under the AARP Health program.
For information regarding prior accident years reserve development, including reserve (releases) strengthenings by reserve line, see the Property and Casualty
Insurance Product Reserves, Net of Reinsurance section within Critical Accounting Estimates.
The effective tax rate, in both periods, differs from the U.S. Federal statutory rate primarily due to permanent differences related to investments in tax exempt
securities. For further discussion, see Income Taxes within Note 14 of the Notes to Consolidated Financial Statements.
82