The Hartford 2012 Annual Report Download - page 132
Download and view the complete annual report
Please find page 132 of the 2012 The Hartford annual report below. You can navigate through the pages in the report by either clicking on the pages listed below, or by using the keyword search tool below to find specific information within the annual report.-
 1
1 -
2
-
3
-
4
-
5
-
6
-
7
-
8
-
9
-
10
-
11
-
12
-
13
-
14
-
15
-
16
-
17
-
18
-
19
-
20
-
21
-
22
-
23
-
24
-
25
-
26
-
27
-
28
-
29
-
30
-
31
-
32
-
33
-
34
-
35
-
36
-
37
-
38
-
39
-
40
-
41
-
42
-
43
-
44
-
45
-
46
-
47
-
48
-
49
-
50
-
51
-
52
-
53
-
54
-
55
-
56
-
57
-
58
-
59
-
60
-
61
-
62
-
63
-
64
-
65
-
66
-
67
-
68
-
69
-
70
-
71
-
72
-
73
-
74
-
75
-
76
-
77
-
78
-
79
-
80
-
81
-
82
-
83
-
84
-
85
-
86
-
87
-
88
-
89
-
90
-
91
-
92
-
93
-
94
-
95
-
96
-
97
-
98
-
99
-
100
-
101
-
102
-
103
-
104
-
105
-
106
-
107
-
108
-
109
-
110
-
111
-
112
-
113
-
114
-
115
-
116
-
117
-
118
-
119
-
120
-
121
-
 122
122 -
 123
123 -
 124
124 -
 125
125 -
 126
126 -
 127
127 -
 128
128 -
 129
129 -
 130
130 -
 131
131 -
 132
132 -
 133
133 -
 134
134 -
 135
135 -
 136
136 -
 137
137 -
 138
138 -
 139
139 -
 140
140 -
 141
141 -
 142
142 -
143
-
144
-
145
-
146
-
147
-
148
-
149
-
150
-
151
-
152
-
153
-
154
-
155
-
156
-
157
-
158
-
159
-
160
-
161
-
162
-
163
-
164
-
165
-
166
-
167
-
168
-
169
-
170
-
171
-
172
-
173
-
174
-
175
-
176
-
177
-
178
-
179
-
180
-
181
-
182
-
183
-
184
-
185
-
186
-
187
-
188
-
189
-
190
-
191
-
192
-
193
-
194
-
195
-
196
-
197
-
198
-
199
-
200
-
201
-
202
-
203
-
204
-
205
-
206
-
207
-
208
-
209
-
210
-
211
-
212
-
213
-
214
-
215
-
216
-
217
-
218
-
219
-
220
-
221
-
222
-
223
-
224
-
225
-
226
-
227
-
228
-
229
-
230
-
231
-
232
-
233
-
234
-
235
-
236
-
237
-
238
-
239
-
240
-
241
-
242
-
243
-
244
-
245
-
246
-
247
-
248
-
249
-
250
-
251
-
252
-
253
-
254
-
255
-
256
-
257
-
258
-
259
-
260
-
261
-
262
-
263
-
264
-
265
-
266
-
267
-
268
-
269
-
270
-
271
-
272
-
273
-
274
-
275
-
276
-
277
-
278
-
279
-
280
-
281
-
282
-
283
-
284
-
285
-
286
-
287
-
288
-
289
-
290
-
291
-
292
-
293
-
294
-
295
-
296
-
297
-
298
-
299
-
300
-
301
-
302
-
303
-
304
-
305
-
306
-
307
-
308
-
309
-
310
-
311
-
312
-
313
-
314
-
315
-
316
-
317
-
318
-
319
-
320
-
321
-
322
-
323
-
324
-
325
-
326
-
327
-
328
-
329
-
330
-
331
-
332
-
333
-
334
-
335
 |
 |

Table of Contents
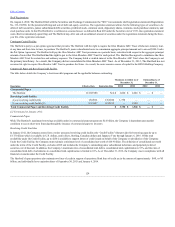
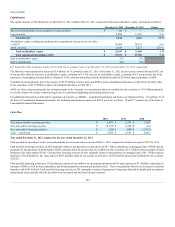
Statutory Surplus
The table below sets forth statutory surplus for the Company’s insurance companies as of December 31, 2012 and 2011:
U.S. life insurance subsidiaries, includes domestic captive insurance subsidiaries $ 6,410 $ 7,388
Property and casualty insurance subsidiaries 7,645 7,412
Statutory capital and surplus for the U.S. life insurance subsidiaries, including domestic captive insurance subsidiaries, decreased by $978, primarily due
to variable annuity surplus impacts of approximately $425, a $200 increase in reserves on a change in valuation basis, $200 transfer of the Mutual Funds
business from the U.S. life insurance companies to the life holding company, and an increase in the asset valuation reserve of $115. As a result of the
January 2013 statutory gain from the sale of the Retirement Plans and Individual Life businesses, the Company's pro forma January 2, 2013 U.S. life
statutory surplus was estimated to be $8.1 billion, before approximately $1.5 billion in extraordinary dividends and return of capital to HFSG Holding
Company.
Statutory capital and surplus for the property and casualty insurance subsidiaries increased by $233, primarily due to statutory net income, after tax, of
$727, unrealized gains of $249, and an increase in statutory admitted deferred tax assets of $77, capital contributions of $14, and an increase of statutory
admitted assets of $7, partially offset by dividends to the HFSG Holding Company of $841. Both net income and dividends are net of interest payments and
dividends, respectively, on an intercompany note between Hartford Holdings, Inc. and Hartford Fire Insurance Company.
The Company also holds regulatory capital and surplus for its operations in Japan. Under the accounting practices and procedures governed by Japanese
regulatory authorities, the Company’s statutory capital and surplus was $1.1 billion and $1.3 billion as of December 31, 2012 and 2011, respectively.
The Company’s stockholders’ equity, as prepared using U.S. generally accepted accounting principles (“U.S. GAAP”) was $22.4 billion as of December 31,
2012. The Company’s estimated aggregate statutory capital and surplus, as prepared in accordance with the National Association of Insurance
Commissioners’ Accounting Practices and Procedures Manual (“U.S. STAT”) was $14.1 billion as of December 31, 2012. Significant differences between
U.S. GAAP stockholders’ equity and aggregate statutory capital and surplus prepared in accordance with U.S. STAT include the following:
•U.S. STAT excludes equity of non-insurance and foreign insurance subsidiaries not held by U.S. insurance subsidiaries.
•Costs incurred by the Company to acquire insurance policies are deferred under U.S. GAAP while those costs are expensed immediately under U.S.
STAT.
•Temporary differences between the book and tax basis of an asset or liability which are recorded as deferred tax assets are evaluated for recoverability
under U.S. GAAP while those amounts deferred are subject to limitations under U.S. STAT.
•The assumptions used in the determination of Life benefit reserves is prescribed under U.S. STAT, while the assumptions used under U.S. GAAP are
generally the Company’s best estimates. The methodologies for determining life insurance reserve amounts may also be different. For example, reserving
for living benefit reserves under U.S. STAT is generally addressed by the Commissioners’ Annuity Reserving Valuation Methodology and the related
Actuarial Guidelines, while under U.S. GAAP, those same living benefits may be considered embedded derivatives and recorded at fair value or they
may be considered SOP 03-1 reserves. The sensitivity of these life insurance reserves to changes in equity markets, as applicable, will be different
between U.S. GAAP and U.S. STAT.
•The difference between the amortized cost and fair value of fixed maturity and other investments, net of tax, is recorded as an increase or decrease to the
carrying value of the related asset and to equity under U.S. GAAP, while U.S. STAT only records certain securities at fair value, such as equity
securities and certain lower rated bonds required by the NAIC to be recorded at the lower of amortized cost or fair value.
•U.S. STAT for life insurance companies establishes a formula reserve for realized and unrealized losses due to default and equity risks associated with
certain invested assets (the Asset Valuation Reserve), while U.S. GAAP does not. Also, for those realized gains and losses caused by changes in interest
rates, U.S. STAT for life insurance companies defers and amortizes the gains and losses, caused by changes in interest rates, into income over the
original life to maturity of the asset sold (the Interest Maintenance Reserve) while U.S. GAAP does not.
•Goodwill arising from the acquisition of a business is tested for recoverability on an annual basis (or more frequently, as necessary) for U.S. GAAP,
while under U.S. STAT goodwill is amortized over a period not to exceed 10 years and the amount of goodwill is limited.
131