The Hartford 2012 Annual Report Download - page 235
Download and view the complete annual report
Please find page 235 of the 2012 The Hartford annual report below. You can navigate through the pages in the report by either clicking on the pages listed below, or by using the keyword search tool below to find specific information within the annual report.-
 1
1 -
2
-
3
-
4
-
5
-
6
-
7
-
8
-
9
-
10
-
11
-
12
-
13
-
14
-
15
-
16
-
17
-
18
-
19
-
20
-
21
-
22
-
23
-
24
-
25
-
26
-
27
-
28
-
29
-
30
-
31
-
32
-
33
-
34
-
35
-
36
-
37
-
38
-
39
-
40
-
41
-
42
-
43
-
44
-
45
-
46
-
47
-
48
-
49
-
50
-
51
-
52
-
53
-
54
-
55
-
56
-
57
-
58
-
59
-
60
-
61
-
62
-
63
-
64
-
65
-
66
-
67
-
68
-
69
-
70
-
71
-
72
-
73
-
74
-
75
-
76
-
77
-
78
-
79
-
80
-
81
-
82
-
83
-
84
-
85
-
86
-
87
-
88
-
89
-
90
-
91
-
92
-
93
-
94
-
95
-
96
-
97
-
98
-
99
-
100
-
101
-
102
-
103
-
104
-
105
-
106
-
107
-
108
-
109
-
110
-
111
-
112
-
113
-
114
-
115
-
116
-
117
-
118
-
119
-
120
-
121
-
122
-
123
-
124
-
125
-
126
-
127
-
128
-
129
-
130
-
131
-
132
-
133
-
134
-
135
-
136
-
137
-
138
-
139
-
140
-
141
-
142
-
143
-
144
-
145
-
146
-
147
-
148
-
149
-
150
-
151
-
152
-
153
-
154
-
155
-
156
-
157
-
158
-
159
-
160
-
161
-
162
-
163
-
164
-
165
-
166
-
167
-
168
-
169
-
170
-
171
-
172
-
173
-
174
-
175
-
176
-
177
-
178
-
179
-
180
-
181
-
182
-
183
-
184
-
185
-
186
-
187
-
188
-
189
-
190
-
191
-
192
-
193
-
194
-
195
-
196
-
197
-
198
-
199
-
200
-
201
-
202
-
203
-
204
-
205
-
206
-
207
-
208
-
209
-
210
-
211
-
212
-
213
-
214
-
215
-
216
-
217
-
218
-
219
-
220
-
221
-
222
-
223
-
224
-
 225
225 -
 226
226 -
 227
227 -
 228
228 -
 229
229 -
 230
230 -
 231
231 -
 232
232 -
 233
233 -
 234
234 -
 235
235 -
 236
236 -
 237
237 -
 238
238 -
 239
239 -
 240
240 -
 241
241 -
 242
242 -
 243
243 -
 244
244 -
 245
245 -
246
-
247
-
248
-
249
-
250
-
251
-
252
-
253
-
254
-
255
-
256
-
257
-
258
-
259
-
260
-
261
-
262
-
263
-
264
-
265
-
266
-
267
-
268
-
269
-
270
-
271
-
272
-
273
-
274
-
275
-
276
-
277
-
278
-
279
-
280
-
281
-
282
-
283
-
284
-
285
-
286
-
287
-
288
-
289
-
290
-
291
-
292
-
293
-
294
-
295
-
296
-
297
-
298
-
299
-
300
-
301
-
302
-
303
-
304
-
305
-
306
-
307
-
308
-
309
-
310
-
311
-
312
-
313
-
314
-
315
-
316
-
317
-
318
-
319
-
320
-
321
-
322
-
323
-
324
-
325
-
326
-
327
-
328
-
329
-
330
-
331
-
332
-
333
-
334
-
335
 |
 |

Table of Contents
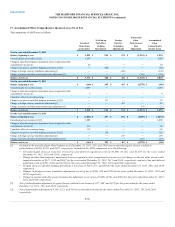
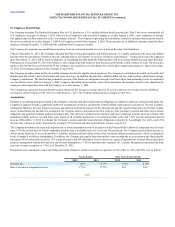
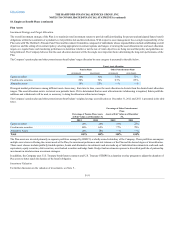
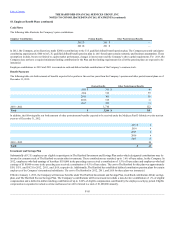
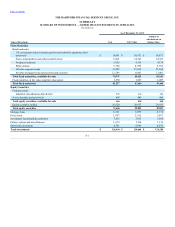
The tables below provide a fair value level 3 rollforward for the twelve months ended December 31, 2012 and 2011 for the Pension Plan Assets for which
significant unobservable inputs (Level 3) are used in the fair value measurement on a recurring basis. The Plan classifies the fair value of financial
instruments within Level 3 if there are no observable markets for the instruments or, in the absence of active markets, if one or more of the significant inputs
used to determine fair value are based on the Plan’s own assumptions. Therefore, the gains and losses in the tables below include changes in fair value due
partly to observable and unobservable factors.
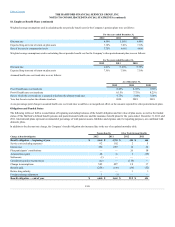
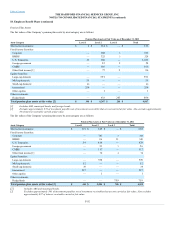
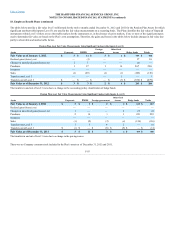
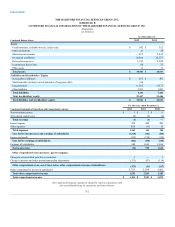
Realized gains/(losses), net —(1) — — 17 16
Changes in unrealized gains/(losses), net 1 1 — — (2) —
Purchases 1 17 1 10 267 296
Issuances — — — — — —
Sales (2) (25) (2)(1)(106)(136)
Transfers into Level 3 — — — 3—3
Transfers out of Level 3 $ — $ — $ — $ (7) $ (672) $ (679)
The transfers in and out of level 3 were due to a change in the accounting policy classification of hedge funds.
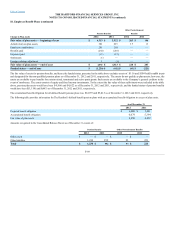
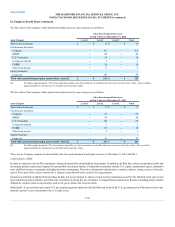
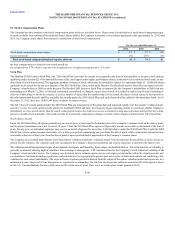
Realized gains/(losses), net — — — — — —
Changes in unrealized gains/(losses), net 1 — — 2 21 24
Purchases 210 31223 239
Issuances — — — — — —
Sales (1) (9) (2)(4)(120)(136)
Transfers into Level 3 1 1 6 2 — 10
Transfers out of Level 3 $(3) $ — $ (6) $ (5) $ — $ (14)
The transfers in and out of level 3 were due to a change in the pricing source.
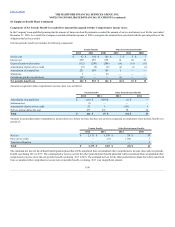
There was no Company common stock included in the Plan’s assets as of December 31, 2012 and 2011.
F-93