The Hartford 2012 Annual Report Download - page 76
Download and view the complete annual report
Please find page 76 of the 2012 The Hartford annual report below. You can navigate through the pages in the report by either clicking on the pages listed below, or by using the keyword search tool below to find specific information within the annual report.-
 1
1 -
2
-
3
-
4
-
5
-
6
-
7
-
8
-
9
-
10
-
11
-
12
-
13
-
14
-
15
-
16
-
17
-
18
-
19
-
20
-
21
-
22
-
23
-
24
-
25
-
26
-
27
-
28
-
29
-
30
-
31
-
32
-
33
-
34
-
35
-
36
-
37
-
38
-
39
-
40
-
41
-
42
-
43
-
44
-
45
-
46
-
47
-
48
-
49
-
50
-
51
-
52
-
53
-
54
-
55
-
56
-
57
-
58
-
59
-
60
-
61
-
62
-
63
-
64
-
65
-
 66
66 -
 67
67 -
 68
68 -
 69
69 -
 70
70 -
 71
71 -
 72
72 -
 73
73 -
 74
74 -
 75
75 -
 76
76 -
 77
77 -
 78
78 -
 79
79 -
 80
80 -
 81
81 -
 82
82 -
 83
83 -
 84
84 -
 85
85 -
 86
86 -
87
-
88
-
89
-
90
-
91
-
92
-
93
-
94
-
95
-
96
-
97
-
98
-
99
-
100
-
101
-
102
-
103
-
104
-
105
-
106
-
107
-
108
-
109
-
110
-
111
-
112
-
113
-
114
-
115
-
116
-
117
-
118
-
119
-
120
-
121
-
122
-
123
-
124
-
125
-
126
-
127
-
128
-
129
-
130
-
131
-
132
-
133
-
134
-
135
-
136
-
137
-
138
-
139
-
140
-
141
-
142
-
143
-
144
-
145
-
146
-
147
-
148
-
149
-
150
-
151
-
152
-
153
-
154
-
155
-
156
-
157
-
158
-
159
-
160
-
161
-
162
-
163
-
164
-
165
-
166
-
167
-
168
-
169
-
170
-
171
-
172
-
173
-
174
-
175
-
176
-
177
-
178
-
179
-
180
-
181
-
182
-
183
-
184
-
185
-
186
-
187
-
188
-
189
-
190
-
191
-
192
-
193
-
194
-
195
-
196
-
197
-
198
-
199
-
200
-
201
-
202
-
203
-
204
-
205
-
206
-
207
-
208
-
209
-
210
-
211
-
212
-
213
-
214
-
215
-
216
-
217
-
218
-
219
-
220
-
221
-
222
-
223
-
224
-
225
-
226
-
227
-
228
-
229
-
230
-
231
-
232
-
233
-
234
-
235
-
236
-
237
-
238
-
239
-
240
-
241
-
242
-
243
-
244
-
245
-
246
-
247
-
248
-
249
-
250
-
251
-
252
-
253
-
254
-
255
-
256
-
257
-
258
-
259
-
260
-
261
-
262
-
263
-
264
-
265
-
266
-
267
-
268
-
269
-
270
-
271
-
272
-
273
-
274
-
275
-
276
-
277
-
278
-
279
-
280
-
281
-
282
-
283
-
284
-
285
-
286
-
287
-
288
-
289
-
290
-
291
-
292
-
293
-
294
-
295
-
296
-
297
-
298
-
299
-
300
-
301
-
302
-
303
-
304
-
305
-
306
-
307
-
308
-
309
-
310
-
311
-
312
-
313
-
314
-
315
-
316
-
317
-
318
-
319
-
320
-
321
-
322
-
323
-
324
-
325
-
326
-
327
-
328
-
329
-
330
-
331
-
332
-
333
-
334
-
335
 |
 |

Table of Contents
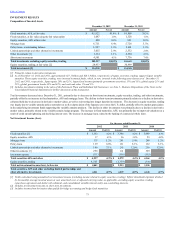
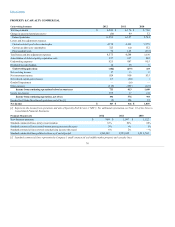
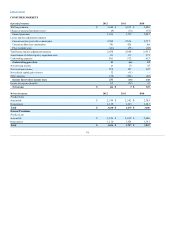
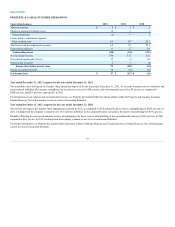
•Gross gains and losses on sales for the year ended December 31, 2010 were predominately from sales of investment grade corporate securities in order to
take advantage of attractive market opportunities, as well as sales of U.S. Treasuries related to tactical repositioning of the portfolio.
Net OTTI losses
•Includes $177 of intent-to-sell impairments for the year ended December 31, 2012, relating to the sales of the Retirement Plans and Individual Life
businesses. For further information, see Other-Than-Temporary Impairments within the Investment Portfolio Risks and Risk Management section of the
MD&A.
Valuation allowances on mortgage loans
•For further information, see Valuation Allowances on Mortgage Loans within the Investment Portfolio Risks and Risk Management section of the MD&A.
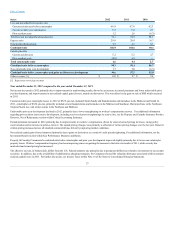
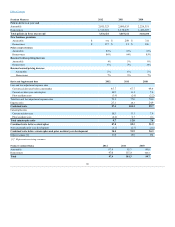
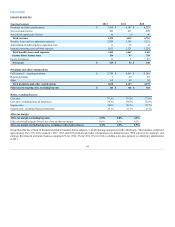
Variable annuity hedge program
•For the year ended December 31, 2012 the gain on U.S. GMWB related derivatives, net, was primarily driven by liability model assumption updates of
$274, gains of $106 related to outperformance of underlying actively managed funds compared to their respective indices, and gains of $83 driven by
lower equity market volatility. The loss on the U.S. macro hedge program for the year ended December 31, 2012 was primarily driven by losses of $167
related to the passage of time, losses of $118 due to an improvement in domestic equity markets, and losses of $60 related to a decrease in equity market
volatility. The loss on the international program for the year ended December 31, 2012 was primarily driven by losses of $795 related to an improvement
in global equity markets and losses of $672 related to depreciation of the Japanese yen in relation to the euro and the U.S. dollar.
•For the year ended December 31, 2011 the loss on U.S. GMWB related derivatives, net, was primarily due to a decrease in long-term interest rates that
resulted in a charge of $283 and a higher interest rate volatility that resulted in a charge of $84. The loss on the U.S. macro hedge program for the year
ended December 31, 2011 was primarily driven by the passage of time and a decrease in equity market volatility since the purchase date of certain options
during the fourth quarter. The gain associated with the international program for the year ended December 31, 2011 was primarily driven by the Japanese
yen strengthening, a decline in global equity markets, and a decrease in interest rates.
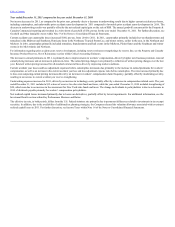
•For the year ended December 31, 2010 the gain on U.S. GMWB related derivatives, net, was primarily due to liability model assumption updates of
$159, gains of $118 related to lower implied market volatility, and gains of $104 related to outperformance of the underlying actively managed funds as
compared to their respective indices. These gains were partially offset by losses of $158 due to a general decrease in long-term interest rates and losses of
$90 related to an improvement in domestic equity markets. The net loss on the U.S. macro hedge program for the year ended December 31, 2010 was
primarily the result of an improvement in domestic equity markets and the impact of trading activity.
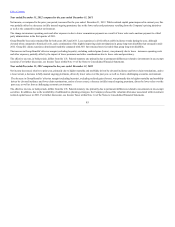
Other, net
•Other, net gain for the year ended December 31, 2012 was primarily related to gains of $313 on credit derivatives due to credit spread tightening, gains of
$269 on transactional foreign currency re-valuation associated with the internal reinsurance of the Japan variable annuity business, which is offset in
AOCI, and gains of $96 on interest derivatives largely driven by the de-designation of the cash flow hedges associated with bonds included in the sale of
Individual Life and Retirement Plans businesses. For further information on the business dispositions, see Note 2 of the Notes to the Consolidated
Financial Statements. These gains were partially offset by losses of $111 related to Japan 3Win foreign currency swaps primarily driven by the
strengthening of the currency basis swap spread between the U.S. dollar and Japanese yen and the decline in U.S. interest rates.
•Other, net loss for the year ended December 31, 2011 was primarily due to losses of $148 on credit derivatives driven by credit spread widening and
losses of $141 on transactional foreign currency re-valuation associated with the internal reinsurance of the Japan variable annuity business, which is
offset in AOCI. Additionally losses of $94 for the year ended December 31, 2011 resulted from equity futures and options used to hedge equity market
risk in the investment portfolio due to an increase in equity market during the hedged period. Also included were losses of $69 on Japan 3Win foreign
currency swaps primarily driven by a decrease in long-term U.S. interest rates.
•Other, net loss for the year ended December 31, 2010 was primarily due to a loss of $326 on transactional foreign currency re-valuation associated with
the internal reinsurance of the Japan variable annuity business, which is offset in AOCI, partially offset by gains of $217 on credit derivatives driven by
credit spread tightening, and gains of $59 on interest rate derivatives used to manage portfolio duration driven by a decline in long-term interest rates.
75