The Hartford 2012 Annual Report Download - page 143
Download and view the complete annual report
Please find page 143 of the 2012 The Hartford annual report below. You can navigate through the pages in the report by either clicking on the pages listed below, or by using the keyword search tool below to find specific information within the annual report.-
 1
1 -
2
-
3
-
4
-
5
-
6
-
7
-
8
-
9
-
10
-
11
-
12
-
13
-
14
-
15
-
16
-
17
-
18
-
19
-
20
-
21
-
22
-
23
-
24
-
25
-
26
-
27
-
28
-
29
-
30
-
31
-
32
-
33
-
34
-
35
-
36
-
37
-
38
-
39
-
40
-
41
-
42
-
43
-
44
-
45
-
46
-
47
-
48
-
49
-
50
-
51
-
52
-
53
-
54
-
55
-
56
-
57
-
58
-
59
-
60
-
61
-
62
-
63
-
64
-
65
-
66
-
67
-
68
-
69
-
70
-
71
-
72
-
73
-
74
-
75
-
76
-
77
-
78
-
79
-
80
-
81
-
82
-
83
-
84
-
85
-
86
-
87
-
88
-
89
-
90
-
91
-
92
-
93
-
94
-
95
-
96
-
97
-
98
-
99
-
100
-
101
-
102
-
103
-
104
-
105
-
106
-
107
-
108
-
109
-
110
-
111
-
112
-
113
-
114
-
115
-
116
-
117
-
118
-
119
-
120
-
121
-
122
-
123
-
124
-
125
-
126
-
127
-
128
-
129
-
130
-
131
-
132
-
 133
133 -
 134
134 -
 135
135 -
 136
136 -
 137
137 -
 138
138 -
 139
139 -
 140
140 -
 141
141 -
 142
142 -
 143
143 -
 144
144 -
 145
145 -
 146
146 -
 147
147 -
 148
148 -
 149
149 -
 150
150 -
 151
151 -
 152
152 -
 153
153 -
154
-
155
-
156
-
157
-
158
-
159
-
160
-
161
-
162
-
163
-
164
-
165
-
166
-
167
-
168
-
169
-
170
-
171
-
172
-
173
-
174
-
175
-
176
-
177
-
178
-
179
-
180
-
181
-
182
-
183
-
184
-
185
-
186
-
187
-
188
-
189
-
190
-
191
-
192
-
193
-
194
-
195
-
196
-
197
-
198
-
199
-
200
-
201
-
202
-
203
-
204
-
205
-
206
-
207
-
208
-
209
-
210
-
211
-
212
-
213
-
214
-
215
-
216
-
217
-
218
-
219
-
220
-
221
-
222
-
223
-
224
-
225
-
226
-
227
-
228
-
229
-
230
-
231
-
232
-
233
-
234
-
235
-
236
-
237
-
238
-
239
-
240
-
241
-
242
-
243
-
244
-
245
-
246
-
247
-
248
-
249
-
250
-
251
-
252
-
253
-
254
-
255
-
256
-
257
-
258
-
259
-
260
-
261
-
262
-
263
-
264
-
265
-
266
-
267
-
268
-
269
-
270
-
271
-
272
-
273
-
274
-
275
-
276
-
277
-
278
-
279
-
280
-
281
-
282
-
283
-
284
-
285
-
286
-
287
-
288
-
289
-
290
-
291
-
292
-
293
-
294
-
295
-
296
-
297
-
298
-
299
-
300
-
301
-
302
-
303
-
304
-
305
-
306
-
307
-
308
-
309
-
310
-
311
-
312
-
313
-
314
-
315
-
316
-
317
-
318
-
319
-
320
-
321
-
322
-
323
-
324
-
325
-
326
-
327
-
328
-
329
-
330
-
331
-
332
-
333
-
334
-
335
 |
 |

Table of Contents
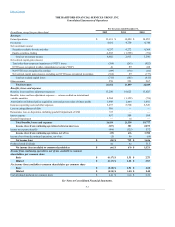
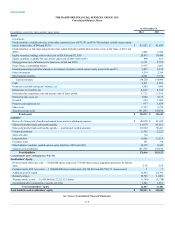
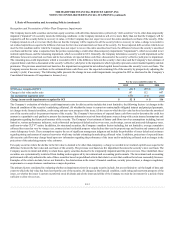
Consolidated Statements of Operations
(In millions, except for per share data)
Revenues
Earned premiums $ 13,631 $ 14,088 $14,055
Fee income 4,432 4,750 4,748
Net investment income:
Securities available-for-sale and other 4,237 4,272 4,364
Equity securities, trading 4,565 (1,359)(774)
Total net investment income 8,802 2,913 3,590
Net realized capital gains (losses):
Total other-than-temporary impairment (“OTTI”) losses (389)(263) (852)
OTTI losses recognized in other comprehensive income (“OCI”) 40 89 418
Net OTTI losses recognized in earnings (349)(174)(434)
Net realized capital gains (losses), excluding net OTTI losses recognized in earnings (362)29 (177)
Total net realized capital losses (711)(145)(611)
Other revenues 258 253 267
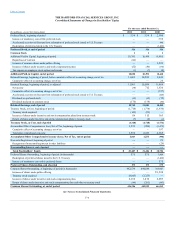
Benefits, losses and expenses
Benefits, losses and loss adjustment expenses 13,250 14,625 13,025
Benefits, losses and loss adjustment expenses — returns credited on international
variable annuities 4,564 (1,359)(774)
Amortization of deferred policy acquisition costs and present value of future profits 1,988 2,444 1,692
Insurance operating costs and other expenses 5,237 5,310 5,326
Loss on extinguishment of debt 910 — —
Reinsurance loss on disposition, including goodwill impairment of $342 533 — —
Interest expense 457 508 508
Goodwill impairment —30 —
Income tax expense (benefit) (494)(325)572
Income (loss) from discontinued operations, net of tax (5) 86 (64)
Preferred stock dividends 42 42 515
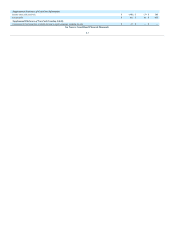
Income from continuing operations, net of tax, available to common
shareholders per common share
Net income (loss) available to common shareholders per common share
Cash dividends declared per common share $0.40 $0.40 $0.20
See Notes to Consolidated Financial Statements.
F-3