The Hartford 2012 Annual Report Download - page 47
Download and view the complete annual report
Please find page 47 of the 2012 The Hartford annual report below. You can navigate through the pages in the report by either clicking on the pages listed below, or by using the keyword search tool below to find specific information within the annual report.-
 1
1 -
2
-
3
-
4
-
5
-
6
-
7
-
8
-
9
-
10
-
11
-
12
-
13
-
14
-
15
-
16
-
17
-
18
-
19
-
20
-
21
-
22
-
23
-
24
-
25
-
26
-
27
-
28
-
29
-
30
-
31
-
32
-
33
-
34
-
35
-
36
-
 37
37 -
 38
38 -
 39
39 -
 40
40 -
 41
41 -
 42
42 -
 43
43 -
 44
44 -
 45
45 -
 46
46 -
 47
47 -
 48
48 -
 49
49 -
 50
50 -
 51
51 -
 52
52 -
 53
53 -
 54
54 -
 55
55 -
 56
56 -
 57
57 -
58
-
59
-
60
-
61
-
62
-
63
-
64
-
65
-
66
-
67
-
68
-
69
-
70
-
71
-
72
-
73
-
74
-
75
-
76
-
77
-
78
-
79
-
80
-
81
-
82
-
83
-
84
-
85
-
86
-
87
-
88
-
89
-
90
-
91
-
92
-
93
-
94
-
95
-
96
-
97
-
98
-
99
-
100
-
101
-
102
-
103
-
104
-
105
-
106
-
107
-
108
-
109
-
110
-
111
-
112
-
113
-
114
-
115
-
116
-
117
-
118
-
119
-
120
-
121
-
122
-
123
-
124
-
125
-
126
-
127
-
128
-
129
-
130
-
131
-
132
-
133
-
134
-
135
-
136
-
137
-
138
-
139
-
140
-
141
-
142
-
143
-
144
-
145
-
146
-
147
-
148
-
149
-
150
-
151
-
152
-
153
-
154
-
155
-
156
-
157
-
158
-
159
-
160
-
161
-
162
-
163
-
164
-
165
-
166
-
167
-
168
-
169
-
170
-
171
-
172
-
173
-
174
-
175
-
176
-
177
-
178
-
179
-
180
-
181
-
182
-
183
-
184
-
185
-
186
-
187
-
188
-
189
-
190
-
191
-
192
-
193
-
194
-
195
-
196
-
197
-
198
-
199
-
200
-
201
-
202
-
203
-
204
-
205
-
206
-
207
-
208
-
209
-
210
-
211
-
212
-
213
-
214
-
215
-
216
-
217
-
218
-
219
-
220
-
221
-
222
-
223
-
224
-
225
-
226
-
227
-
228
-
229
-
230
-
231
-
232
-
233
-
234
-
235
-
236
-
237
-
238
-
239
-
240
-
241
-
242
-
243
-
244
-
245
-
246
-
247
-
248
-
249
-
250
-
251
-
252
-
253
-
254
-
255
-
256
-
257
-
258
-
259
-
260
-
261
-
262
-
263
-
264
-
265
-
266
-
267
-
268
-
269
-
270
-
271
-
272
-
273
-
274
-
275
-
276
-
277
-
278
-
279
-
280
-
281
-
282
-
283
-
284
-
285
-
286
-
287
-
288
-
289
-
290
-
291
-
292
-
293
-
294
-
295
-
296
-
297
-
298
-
299
-
300
-
301
-
302
-
303
-
304
-
305
-
306
-
307
-
308
-
309
-
310
-
311
-
312
-
313
-
314
-
315
-
316
-
317
-
318
-
319
-
320
-
321
-
322
-
323
-
324
-
325
-
326
-
327
-
328
-
329
-
330
-
331
-
332
-
333
-
334
-
335
 |
 |

Table of Contents
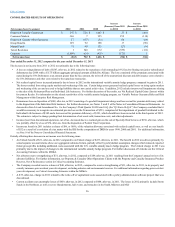
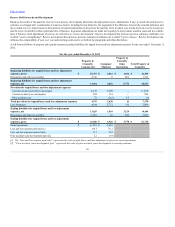
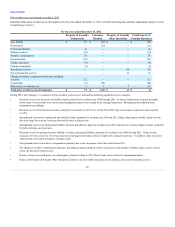
Impact of changes in key assumptions on reserve volatility
As stated above, the Company’s practice is to estimate reserves using a variety of methods, assumptions and data elements. Within its reserve estimation
process for reserves other than asbestos and environmental, the Company does not consistently use statistical loss distributions or confidence levels around its
reserve estimate and, as a result, does not disclose reserve ranges.
The reserve estimation process includes assumptions about a number of factors in the internal and external environment. Across most lines of business, the
most important assumptions are future loss development factors applied to paid or reported losses to date. The trend in loss costs is also a key assumption,
particularly in the most recent accident years, where loss development factors are less credible.
The following discussion includes disclosure of possible variation from current estimates of loss reserves due to a change in certain key indicators of potential
losses. Each of the impacts described below is estimated individually, without consideration for any correlation among key indicators or among lines of
business. Therefore, it would be inappropriate to take each of the amounts described below and add them together in an attempt to estimate volatility for the
Company’s reserves in total. The estimated variation in reserves due to changes in key indicators is a reasonable estimate of possible variation that may occur
in the future, likely over a period of several calendar years. It is important to note that the variation discussed is not meant to be a worst-case scenario, and
therefore, it is possible that future variation may be more than the amounts discussed below.
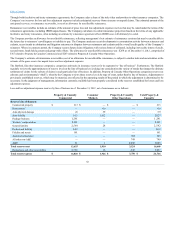
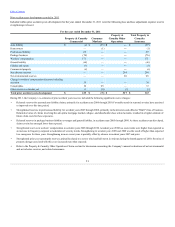
Recorded reserves for auto liability, net of reinsurance, are $2.0 billion across all lines, $1.4 billion of which is in Consumer Markets. Personal auto liability
reserves are shorter-tailed than other lines of business (such as workers’ compensation) and, therefore, less volatile. However, the size of the reserve base
means that future changes in estimates could be material to the Company’s results of operations in any given period. The key indicator for Consumer Markets
auto liability is the annual loss cost trend, particularly the severity trend component of loss costs. A 2.5 point change in annual severity for the two most
recent accident years would change the estimated net reserve need by $80, in either direction. A 2.5 point change in annual severity is within the Company’s
historical variation.
Recorded reserves for workers’ compensation, net of reinsurance, are $8.1 billion. Loss development patterns are a key indicator for this line of business,
particularly for more mature accident years. Historically, loss development patterns have been impacted by, among other things, medical cost inflation and
other changes in loss cost trends. The Company has reviewed the historical variation in reported loss development patterns. If the reported loss development
patterns change by 3%, the estimated net reserve need would change by $500, in either direction. A 3% change in reported loss development patterns is within
the Company’s historical variation, as measured by the variation around the average development factors as reported in statutory accident year reports.
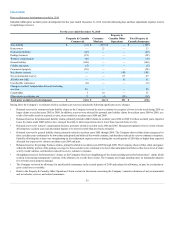
Recorded reserves for general liability, net of reinsurance, are $2.6 billion. Loss development patterns are a key indicator for this line of business, particularly
for more mature accident years. Historically, loss development patterns have been impacted by, among other things, emergence of new types of claims (e.g.,
construction defect claims) or a shift in the mixture between smaller, more routine claims and larger, more complex claims. The Company has reviewed the
historical variation in reported loss development patterns. If the reported loss development patterns change by 9%, the estimated net reserve need would change
by $200, in either direction. A 9% change in reported loss development patterns is within the Company’s historical variation, as measured by the variation
around the average development factors as reported in statutory accident year reports.
46