The Hartford 2012 Annual Report Download - page 101
Download and view the complete annual report
Please find page 101 of the 2012 The Hartford annual report below. You can navigate through the pages in the report by either clicking on the pages listed below, or by using the keyword search tool below to find specific information within the annual report.-
 1
1 -
2
-
3
-
4
-
5
-
6
-
7
-
8
-
9
-
10
-
11
-
12
-
13
-
14
-
15
-
16
-
17
-
18
-
19
-
20
-
21
-
22
-
23
-
24
-
25
-
26
-
27
-
28
-
29
-
30
-
31
-
32
-
33
-
34
-
35
-
36
-
37
-
38
-
39
-
40
-
41
-
42
-
43
-
44
-
45
-
46
-
47
-
48
-
49
-
50
-
51
-
52
-
53
-
54
-
55
-
56
-
57
-
58
-
59
-
60
-
61
-
62
-
63
-
64
-
65
-
66
-
67
-
68
-
69
-
70
-
71
-
72
-
73
-
74
-
75
-
76
-
77
-
78
-
79
-
80
-
81
-
82
-
83
-
84
-
85
-
86
-
87
-
88
-
89
-
90
-
 91
91 -
 92
92 -
 93
93 -
 94
94 -
 95
95 -
 96
96 -
 97
97 -
 98
98 -
 99
99 -
 100
100 -
 101
101 -
 102
102 -
 103
103 -
 104
104 -
 105
105 -
 106
106 -
 107
107 -
 108
108 -
 109
109 -
 110
110 -
 111
111 -
112
-
113
-
114
-
115
-
116
-
117
-
118
-
119
-
120
-
121
-
122
-
123
-
124
-
125
-
126
-
127
-
128
-
129
-
130
-
131
-
132
-
133
-
134
-
135
-
136
-
137
-
138
-
139
-
140
-
141
-
142
-
143
-
144
-
145
-
146
-
147
-
148
-
149
-
150
-
151
-
152
-
153
-
154
-
155
-
156
-
157
-
158
-
159
-
160
-
161
-
162
-
163
-
164
-
165
-
166
-
167
-
168
-
169
-
170
-
171
-
172
-
173
-
174
-
175
-
176
-
177
-
178
-
179
-
180
-
181
-
182
-
183
-
184
-
185
-
186
-
187
-
188
-
189
-
190
-
191
-
192
-
193
-
194
-
195
-
196
-
197
-
198
-
199
-
200
-
201
-
202
-
203
-
204
-
205
-
206
-
207
-
208
-
209
-
210
-
211
-
212
-
213
-
214
-
215
-
216
-
217
-
218
-
219
-
220
-
221
-
222
-
223
-
224
-
225
-
226
-
227
-
228
-
229
-
230
-
231
-
232
-
233
-
234
-
235
-
236
-
237
-
238
-
239
-
240
-
241
-
242
-
243
-
244
-
245
-
246
-
247
-
248
-
249
-
250
-
251
-
252
-
253
-
254
-
255
-
256
-
257
-
258
-
259
-
260
-
261
-
262
-
263
-
264
-
265
-
266
-
267
-
268
-
269
-
270
-
271
-
272
-
273
-
274
-
275
-
276
-
277
-
278
-
279
-
280
-
281
-
282
-
283
-
284
-
285
-
286
-
287
-
288
-
289
-
290
-
291
-
292
-
293
-
294
-
295
-
296
-
297
-
298
-
299
-
300
-
301
-
302
-
303
-
304
-
305
-
306
-
307
-
308
-
309
-
310
-
311
-
312
-
313
-
314
-
315
-
316
-
317
-
318
-
319
-
320
-
321
-
322
-
323
-
324
-
325
-
326
-
327
-
328
-
329
-
330
-
331
-
332
-
333
-
334
-
335
 |
 |

Table of Contents
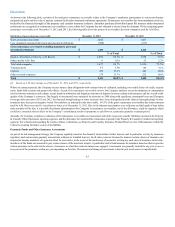
Interest Rate Sensitivity
The before-tax change in the net economic value of investment contracts (e.g., fixed annuity contracts) issued by the Company’s Talcott Resolution segment, as
well as certain insurance product liabilities (e.g., short-term and long-term disability contracts) issued by the Company’s Group Benefits segment, for which
the payment rates are fixed at contract issuance and the investment experience is substantially absorbed by the Company’s operations, along with the
corresponding invested assets are included in the following table. Also included in this analysis are the interest rate sensitive derivatives used by the Company
to hedge its exposure to interest rate risk in the investment portfolios supporting these contracts. This analysis does not include the assets and corresponding
liabilities of certain insurance products such as auto, property, whole and term life insurance, and certain life contingent annuities. Certain financial
instruments, such as limited partnerships and other alternative investments, have been omitted from the analysis due to the fact that the investments generally
lack sensitivity to interest rate changes. Separate account assets and liabilities, equity securities, trading and the corresponding liabilities associated with the
variable annuity products sold in Japan are excluded from the analysis because gains and losses in separate accounts accrue to policyholders. The calculation
of the estimated hypothetical change in net economic value below assumes a 100 basis point upward and downward parallel shift in the yield curve.
Basis point shift --100 +100 -100 +100
Amount $(294) $ 135 $ (494) $ 287
The fixed liabilities included above represented approximately 41% and 43% of the Company’s general account liabilities as of December 31, 2012 and 2011,
respectively. The assets supporting the fixed liabilities are monitored and managed within set duration guidelines, and are evaluated on a daily basis, as well as
annually using scenario simulation techniques in compliance with regulatory requirements.
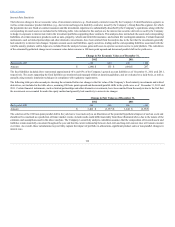
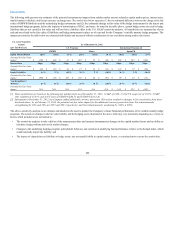
The following table provides an analysis showing the estimated before-tax change in the fair value of the Company’s fixed maturity investments and related
derivatives, not included in the table above, assuming 100 basis point upward and downward parallel shifts in the yield curve as of December 31, 2012 and
2011. Certain financial instruments, such as limited partnerships and other alternative investments, have been omitted from the analysis due to the fact that
the investments are accounted for under the equity method and generally lack sensitivity to interest rate changes.
Basis point shift --100 +100 -100 +100
Amount $3,406 $(3,357) $ 3,248 $(2,985)
The selection of the 100 basis point parallel shift in the yield curve was made only as an illustration of the potential hypothetical impact of such an event and
should not be construed as a prediction of future market events. Actual results could differ materially from those illustrated above due to the nature of the
estimates and assumptions used in the above analysis. The Company’s sensitivity analysis calculation assumes that the composition of invested assets and
liabilities remain materially consistent throughout the year and that the current relationship between short-term and long-term interest rates will remain constant
over time. As a result, these calculations may not fully capture the impact of portfolio re-allocations, significant product sales or non-parallel changes in
interest rates.
100