The Hartford 2012 Annual Report Download - page 204
Download and view the complete annual report
Please find page 204 of the 2012 The Hartford annual report below. You can navigate through the pages in the report by either clicking on the pages listed below, or by using the keyword search tool below to find specific information within the annual report.-
 1
1 -
2
-
3
-
4
-
5
-
6
-
7
-
8
-
9
-
10
-
11
-
12
-
13
-
14
-
15
-
16
-
17
-
18
-
19
-
20
-
21
-
22
-
23
-
24
-
25
-
26
-
27
-
28
-
29
-
30
-
31
-
32
-
33
-
34
-
35
-
36
-
37
-
38
-
39
-
40
-
41
-
42
-
43
-
44
-
45
-
46
-
47
-
48
-
49
-
50
-
51
-
52
-
53
-
54
-
55
-
56
-
57
-
58
-
59
-
60
-
61
-
62
-
63
-
64
-
65
-
66
-
67
-
68
-
69
-
70
-
71
-
72
-
73
-
74
-
75
-
76
-
77
-
78
-
79
-
80
-
81
-
82
-
83
-
84
-
85
-
86
-
87
-
88
-
89
-
90
-
91
-
92
-
93
-
94
-
95
-
96
-
97
-
98
-
99
-
100
-
101
-
102
-
103
-
104
-
105
-
106
-
107
-
108
-
109
-
110
-
111
-
112
-
113
-
114
-
115
-
116
-
117
-
118
-
119
-
120
-
121
-
122
-
123
-
124
-
125
-
126
-
127
-
128
-
129
-
130
-
131
-
132
-
133
-
134
-
135
-
136
-
137
-
138
-
139
-
140
-
141
-
142
-
143
-
144
-
145
-
146
-
147
-
148
-
149
-
150
-
151
-
152
-
153
-
154
-
155
-
156
-
157
-
158
-
159
-
160
-
161
-
162
-
163
-
164
-
165
-
166
-
167
-
168
-
169
-
170
-
171
-
172
-
173
-
174
-
175
-
176
-
177
-
178
-
179
-
180
-
181
-
182
-
183
-
184
-
185
-
186
-
187
-
188
-
189
-
190
-
191
-
192
-
193
-
 194
194 -
 195
195 -
 196
196 -
 197
197 -
 198
198 -
 199
199 -
 200
200 -
 201
201 -
 202
202 -
 203
203 -
 204
204 -
 205
205 -
 206
206 -
 207
207 -
 208
208 -
 209
209 -
 210
210 -
 211
211 -
 212
212 -
 213
213 -
 214
214 -
215
-
216
-
217
-
218
-
219
-
220
-
221
-
222
-
223
-
224
-
225
-
226
-
227
-
228
-
229
-
230
-
231
-
232
-
233
-
234
-
235
-
236
-
237
-
238
-
239
-
240
-
241
-
242
-
243
-
244
-
245
-
246
-
247
-
248
-
249
-
250
-
251
-
252
-
253
-
254
-
255
-
256
-
257
-
258
-
259
-
260
-
261
-
262
-
263
-
264
-
265
-
266
-
267
-
268
-
269
-
270
-
271
-
272
-
273
-
274
-
275
-
276
-
277
-
278
-
279
-
280
-
281
-
282
-
283
-
284
-
285
-
286
-
287
-
288
-
289
-
290
-
291
-
292
-
293
-
294
-
295
-
296
-
297
-
298
-
299
-
300
-
301
-
302
-
303
-
304
-
305
-
306
-
307
-
308
-
309
-
310
-
311
-
312
-
313
-
314
-
315
-
316
-
317
-
318
-
319
-
320
-
321
-
322
-
323
-
324
-
325
-
326
-
327
-
328
-
329
-
330
-
331
-
332
-
333
-
334
-
335
 |
 |

Table of Contents
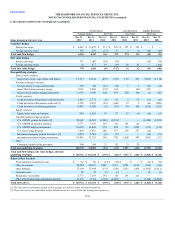
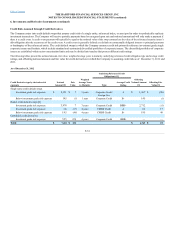
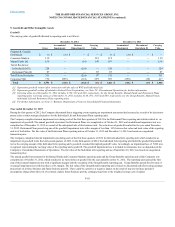
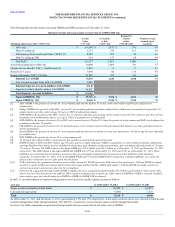
Single name credit default swaps
Investment grade risk exposure
$1,628 $(34)3 years
Corporate Credit/
Foreign Gov. A+ $1,424 $ (15)
Below investment grade risk exposure 170 (7)2 years Corporate Credit BB- 144 (5)
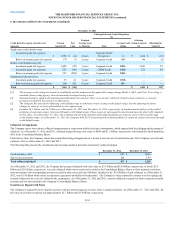
Basket credit default swaps [4]
Investment grade risk exposure 3,645 (92) 3 years Corporate Credit BBB+ 2,001 29
Investment grade risk exposure 525 (98) 5 years CMBS Credit BBB+ 525 98
Below investment grade risk exposure 553 (509) 3 years Corporate Credit BBB+ — —
Embedded credit derivatives
Investment grade risk exposure 25 24 3 years Corporate Credit BBB- — —
Below investment grade risk exposure 500 411 5 years Corporate Credit BB+ — —
[1] The average credit ratings are based on availability and the midpoint of the applicable ratings among Moody’s, S&P, and Fitch. If no rating is
available from a rating agency, then an internally developed rating is used.
[2] Notional amount is equal to the maximum potential future loss amount. There is no specific collateral related to these contracts or recourse
provisions included in the contracts to offset losses.
[3] The Company has entered into offsetting credit default swaps to terminate certain existing credit default swaps, thereby offsetting the future
changes in value of, or losses paid related to, the original swap.
[4] Includes $4.5 billion and $4.2 billion as of December 31, 2012 and December 31, 2011, respectively, of standard market indices of diversified
portfolios of corporate issuers referenced through credit default swaps. These swaps are subsequently valued based upon the observable standard
market index. As of December 31, 2012, The Company did not hold customized diversified portfolios of corporate issuers referenced through
credit default swaps. As of December 31, 2011 the Company held $553 of customized diversified portfolios of corporate issuers referenced through
credit default swaps.
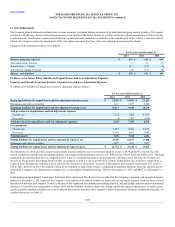
The Company enters into various collateral arrangements in connection with its derivative instruments, which require both the pledging and accepting of
collateral. As of December 31, 2012 and 2011, collateral pledged having a fair value of $630 and $1.1 billion, respectively, was included in fixed maturities,
AFS, in the Consolidated Balance Sheets.
From time to time, the Company enters into secured borrowing arrangements as a means to increase net investment income. The Company received cash
collateral of $33 as of December 31, 2012 and 2011.
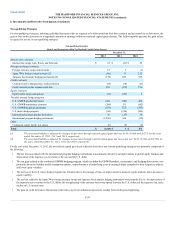
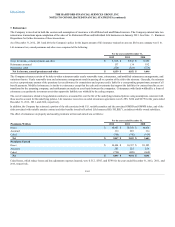
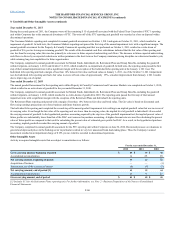
The following table presents the classification and carrying amount of derivative instruments collateral pledged.
Fixed maturities, AFS $663 $1,086
Short-term investments 208 199
As of December 31, 2012 and 2011, the Company had accepted collateral with a fair value of $3.3 billion and $2.6 billion, respectively, of which $2.6
billion and $2.0 billion, respectively, was cash collateral which was invested and recorded in the Consolidated Balance Sheets in fixed maturities and short-
term investments with corresponding amounts recorded in other assets and other liabilities. Included in the $2.6 billion of cash collateral, as of December 31,
2012, was $1.9 billion which relates to repurchase agreements and dollar roll transactions. The Company is only permitted by contract to sell or repledge the
noncash collateral in the event of a default by the counterparty. As of December 31, 2012 and 2011, noncash collateral accepted was held in separate custodial
accounts and was not included in the Company’s Consolidated Balance Sheets.
The Company is required by law to deposit securities with government agencies in states where it conducts business. As of December 31, 2012 and 2011, the
fair value of securities on deposit was approximately $1.7 billion and $1.6 billion, respectively.
F-62