The Hartford 2012 Annual Report Download - page 119
Download and view the complete annual report
Please find page 119 of the 2012 The Hartford annual report below. You can navigate through the pages in the report by either clicking on the pages listed below, or by using the keyword search tool below to find specific information within the annual report.-
 1
1 -
2
-
3
-
4
-
5
-
6
-
7
-
8
-
9
-
10
-
11
-
12
-
13
-
14
-
15
-
16
-
17
-
18
-
19
-
20
-
21
-
22
-
23
-
24
-
25
-
26
-
27
-
28
-
29
-
30
-
31
-
32
-
33
-
34
-
35
-
36
-
37
-
38
-
39
-
40
-
41
-
42
-
43
-
44
-
45
-
46
-
47
-
48
-
49
-
50
-
51
-
52
-
53
-
54
-
55
-
56
-
57
-
58
-
59
-
60
-
61
-
62
-
63
-
64
-
65
-
66
-
67
-
68
-
69
-
70
-
71
-
72
-
73
-
74
-
75
-
76
-
77
-
78
-
79
-
80
-
81
-
82
-
83
-
84
-
85
-
86
-
87
-
88
-
89
-
90
-
91
-
92
-
93
-
94
-
95
-
96
-
97
-
98
-
99
-
100
-
101
-
102
-
103
-
104
-
105
-
106
-
107
-
108
-
 109
109 -
 110
110 -
 111
111 -
 112
112 -
 113
113 -
 114
114 -
 115
115 -
 116
116 -
 117
117 -
 118
118 -
 119
119 -
 120
120 -
 121
121 -
 122
122 -
 123
123 -
 124
124 -
 125
125 -
 126
126 -
 127
127 -
 128
128 -
 129
129 -
130
-
131
-
132
-
133
-
134
-
135
-
136
-
137
-
138
-
139
-
140
-
141
-
142
-
143
-
144
-
145
-
146
-
147
-
148
-
149
-
150
-
151
-
152
-
153
-
154
-
155
-
156
-
157
-
158
-
159
-
160
-
161
-
162
-
163
-
164
-
165
-
166
-
167
-
168
-
169
-
170
-
171
-
172
-
173
-
174
-
175
-
176
-
177
-
178
-
179
-
180
-
181
-
182
-
183
-
184
-
185
-
186
-
187
-
188
-
189
-
190
-
191
-
192
-
193
-
194
-
195
-
196
-
197
-
198
-
199
-
200
-
201
-
202
-
203
-
204
-
205
-
206
-
207
-
208
-
209
-
210
-
211
-
212
-
213
-
214
-
215
-
216
-
217
-
218
-
219
-
220
-
221
-
222
-
223
-
224
-
225
-
226
-
227
-
228
-
229
-
230
-
231
-
232
-
233
-
234
-
235
-
236
-
237
-
238
-
239
-
240
-
241
-
242
-
243
-
244
-
245
-
246
-
247
-
248
-
249
-
250
-
251
-
252
-
253
-
254
-
255
-
256
-
257
-
258
-
259
-
260
-
261
-
262
-
263
-
264
-
265
-
266
-
267
-
268
-
269
-
270
-
271
-
272
-
273
-
274
-
275
-
276
-
277
-
278
-
279
-
280
-
281
-
282
-
283
-
284
-
285
-
286
-
287
-
288
-
289
-
290
-
291
-
292
-
293
-
294
-
295
-
296
-
297
-
298
-
299
-
300
-
301
-
302
-
303
-
304
-
305
-
306
-
307
-
308
-
309
-
310
-
311
-
312
-
313
-
314
-
315
-
316
-
317
-
318
-
319
-
320
-
321
-
322
-
323
-
324
-
325
-
326
-
327
-
328
-
329
-
330
-
331
-
332
-
333
-
334
-
335
 |
 |

Table of Contents
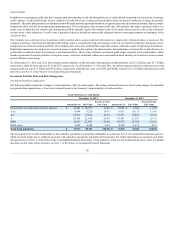
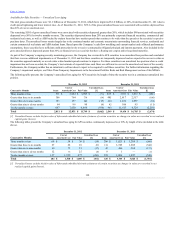
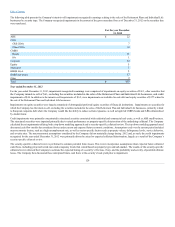
Available-for-Sale Securities — Unrealized Loss Aging
The total gross unrealized losses were $1.1 billion as of December 31, 2012, which have improved $1.6 billion, or 60%, from December 31, 2011 due to
credit spread tightening and lower interest rates. As of December 31, 2012, $561 of the gross unrealized losses were associated with securities depressed less
than 20% of cost or amortized cost.
The remaining $501 of gross unrealized losses were associated with securities depressed greater than 20%, which includes $90 associated with securities
depressed over 50% for twelve months or more. The securities depressed more than 20% are primarily corporate financial securities, commercial and
residential real estate, as well as ABS backed by student loans that have market spreads that continue to be wider than the spreads at the securities' respective
purchase dates. The unrealized losses remain largely due to the continued market and economic uncertainties surrounding financial services, residential and
certain commercial real estate and ABS student loans. Based upon the Company’s cash flow modeling and current market and collateral performance
assumptions, these securities have sufficient credit protection levels to receive contractually obligated principal and interest payments. Also included in the
gross unrealized losses depressed greater than 20% are financial services securities that have a floating-rate coupon and/or long-dated maturities.
As part of the Company’s ongoing security monitoring process, the Company has reviewed its AFS securities in an unrealized loss position and concluded
that there were no additional impairments as of December 31, 2012 and that these securities are temporarily depressed and are expected to recover in value as
the securities approach maturity or as real estate related market spreads continue to improve. For these securities in an unrealized loss position where a credit
impairment has not been recorded, the Company’s best estimate of expected future cash flows are sufficient to recover the amortized cost basis of the security.
Furthermore, the Company neither has an intention to sell nor does it expect to be required to sell these securities. For further information regarding the
Company’s impairment analysis, see Other-Than-Temporary Impairments in the Investment Portfolio Risks and Risk Management section of this MD&A.
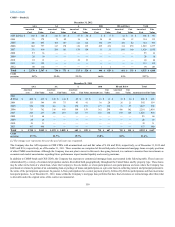
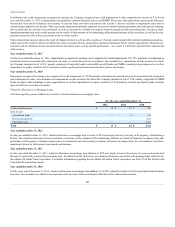
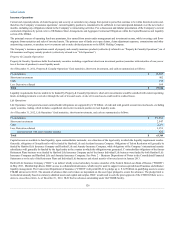
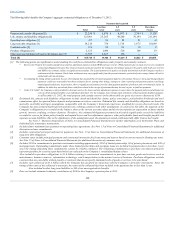
The following table presents the Company’s unrealized loss aging for AFS securities by length of time the security was in a continuous unrealized loss
position.
Three months or less 771 $ 3,964 $ 3,893 $ (71)855 $3,933 $3,672 $ (261)
Greater than three to six months 306 764 730 (34) 485 2,617 2,517 (100)
Greater than six to nine months 183 157 142 (15) 224 1,181 1,097 (84)
Greater than nine to eleven months 64 96 90 (6) 42 106 95 (11)
Twelve months or more 687 7,850 6,894 (936) 943 11,613 9,324 (2,218)
[1] Unrealized losses exclude the fair value of bifurcated embedded derivative features of certain securities as changes in value are recorded in net realized
capital gains (losses).
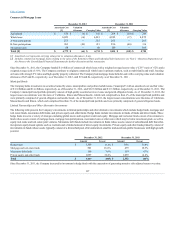
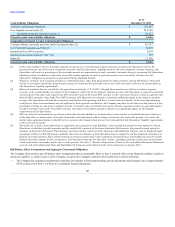
The following tables present the Company’s unrealized loss aging for AFS securities continuously depressed over 20% by length of time (included in the table
above).
Three months or less 68 $ 54 $ 36 $ (18) 206 $ 1,823 $ 1,289 $(500)
Greater than three to six months 27 22 16 (6) 134 1,749 1,205 (544)
Greater than six to nine months 20 72 55 (17)42 406 269 (137)
Greater than nine to eleven months 12 33 25 (8) 9 1 — (1)
Twelve months or more 157 1,329 877 (452) 239 1,806 1,057 (749)
[1] Unrealized losses exclude the fair value of bifurcated embedded derivatives features of certain securities as changes in value are recorded in net
realized capital gains (losses).
118