The Hartford 2012 Annual Report Download - page 232
Download and view the complete annual report
Please find page 232 of the 2012 The Hartford annual report below. You can navigate through the pages in the report by either clicking on the pages listed below, or by using the keyword search tool below to find specific information within the annual report.-
 1
1 -
2
-
3
-
4
-
5
-
6
-
7
-
8
-
9
-
10
-
11
-
12
-
13
-
14
-
15
-
16
-
17
-
18
-
19
-
20
-
21
-
22
-
23
-
24
-
25
-
26
-
27
-
28
-
29
-
30
-
31
-
32
-
33
-
34
-
35
-
36
-
37
-
38
-
39
-
40
-
41
-
42
-
43
-
44
-
45
-
46
-
47
-
48
-
49
-
50
-
51
-
52
-
53
-
54
-
55
-
56
-
57
-
58
-
59
-
60
-
61
-
62
-
63
-
64
-
65
-
66
-
67
-
68
-
69
-
70
-
71
-
72
-
73
-
74
-
75
-
76
-
77
-
78
-
79
-
80
-
81
-
82
-
83
-
84
-
85
-
86
-
87
-
88
-
89
-
90
-
91
-
92
-
93
-
94
-
95
-
96
-
97
-
98
-
99
-
100
-
101
-
102
-
103
-
104
-
105
-
106
-
107
-
108
-
109
-
110
-
111
-
112
-
113
-
114
-
115
-
116
-
117
-
118
-
119
-
120
-
121
-
122
-
123
-
124
-
125
-
126
-
127
-
128
-
129
-
130
-
131
-
132
-
133
-
134
-
135
-
136
-
137
-
138
-
139
-
140
-
141
-
142
-
143
-
144
-
145
-
146
-
147
-
148
-
149
-
150
-
151
-
152
-
153
-
154
-
155
-
156
-
157
-
158
-
159
-
160
-
161
-
162
-
163
-
164
-
165
-
166
-
167
-
168
-
169
-
170
-
171
-
172
-
173
-
174
-
175
-
176
-
177
-
178
-
179
-
180
-
181
-
182
-
183
-
184
-
185
-
186
-
187
-
188
-
189
-
190
-
191
-
192
-
193
-
194
-
195
-
196
-
197
-
198
-
199
-
200
-
201
-
202
-
203
-
204
-
205
-
206
-
207
-
208
-
209
-
210
-
211
-
212
-
213
-
214
-
215
-
216
-
217
-
218
-
219
-
220
-
221
-
 222
222 -
 223
223 -
 224
224 -
 225
225 -
 226
226 -
 227
227 -
 228
228 -
 229
229 -
 230
230 -
 231
231 -
 232
232 -
 233
233 -
 234
234 -
 235
235 -
 236
236 -
 237
237 -
 238
238 -
 239
239 -
 240
240 -
 241
241 -
 242
242 -
243
-
244
-
245
-
246
-
247
-
248
-
249
-
250
-
251
-
252
-
253
-
254
-
255
-
256
-
257
-
258
-
259
-
260
-
261
-
262
-
263
-
264
-
265
-
266
-
267
-
268
-
269
-
270
-
271
-
272
-
273
-
274
-
275
-
276
-
277
-
278
-
279
-
280
-
281
-
282
-
283
-
284
-
285
-
286
-
287
-
288
-
289
-
290
-
291
-
292
-
293
-
294
-
295
-
296
-
297
-
298
-
299
-
300
-
301
-
302
-
303
-
304
-
305
-
306
-
307
-
308
-
309
-
310
-
311
-
312
-
313
-
314
-
315
-
316
-
317
-
318
-
319
-
320
-
321
-
322
-
323
-
324
-
325
-
326
-
327
-
328
-
329
-
330
-
331
-
332
-
333
-
334
-
335
 |
 |

Table of Contents
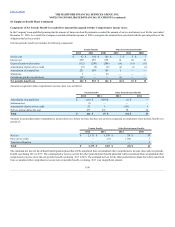
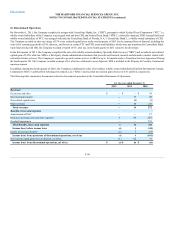
In the Company’s non-qualified pension plan the amount of lump sum benefit payments exceeded the amount of service and interest cost for the year ended
December 31, 2010. As a result, the Company recorded settlement expense of $20 to recognize the actuarial loss associated with the pro-rata portion of the
obligation that has been settled.
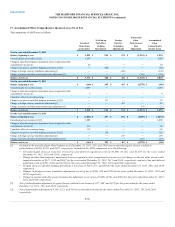
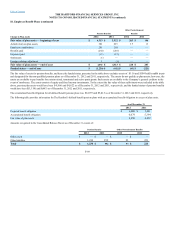
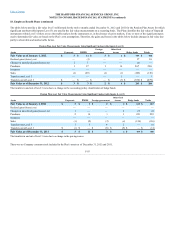
Total net periodic benefit cost includes the following components:
Service cost $92 $102 $102 $ 2 $ 5 $ 7
Interest cost 250 259 252 14 20 22
Expected return on plan assets (312) (298) (286) (14)(14)(13)
Amortization of prior service credit (9) (9) (9) (4)(1)(1)
Amortization of actuarial loss 231 159 107 1 — —
Settlements 1 — 20 — — —
Curtailment gain due to plan freeze (11) — — (1) — —
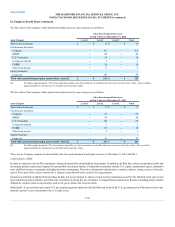
Amounts recognized in other comprehensive income (loss) were as follows:
Amortization of actuarial loss $(231) $ (159) $ (1) $ —
Settlement loss (1) — — —
Amortization of prior service credit 21 9 (111) 1
Net loss arising during the year 477 237 18 24
Amounts in accumulated other comprehensive income (loss) on a before tax basis that have not yet been recognized as components of net periodic benefit cost
consist of:
Net loss $2,175 $ 1,930 $ 58 $ 39
Prior service credit —(21)(110) 1
Transition obligation — — — 2
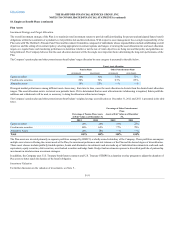
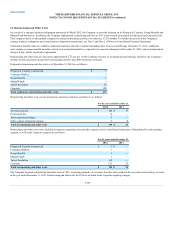
The estimated net loss for the defined benefit pension plans that will be amortized from accumulated other comprehensive income (loss) into net periodic
benefit cost during 2013 is $57. The estimated prior service cost for the other postretirement benefit plans that will be amortized from accumulated other
comprehensive income (loss) into net periodic benefit cost during 2013 is $(7). The estimated net loss for the other postretirement plans that will be amortized
from accumulated other comprehensive income into net periodic benefit cost during 2013 is an insignificant amount.
F-90