The Hartford 2012 Annual Report Download - page 192
Download and view the complete annual report
Please find page 192 of the 2012 The Hartford annual report below. You can navigate through the pages in the report by either clicking on the pages listed below, or by using the keyword search tool below to find specific information within the annual report.-
 1
1 -
2
-
3
-
4
-
5
-
6
-
7
-
8
-
9
-
10
-
11
-
12
-
13
-
14
-
15
-
16
-
17
-
18
-
19
-
20
-
21
-
22
-
23
-
24
-
25
-
26
-
27
-
28
-
29
-
30
-
31
-
32
-
33
-
34
-
35
-
36
-
37
-
38
-
39
-
40
-
41
-
42
-
43
-
44
-
45
-
46
-
47
-
48
-
49
-
50
-
51
-
52
-
53
-
54
-
55
-
56
-
57
-
58
-
59
-
60
-
61
-
62
-
63
-
64
-
65
-
66
-
67
-
68
-
69
-
70
-
71
-
72
-
73
-
74
-
75
-
76
-
77
-
78
-
79
-
80
-
81
-
82
-
83
-
84
-
85
-
86
-
87
-
88
-
89
-
90
-
91
-
92
-
93
-
94
-
95
-
96
-
97
-
98
-
99
-
100
-
101
-
102
-
103
-
104
-
105
-
106
-
107
-
108
-
109
-
110
-
111
-
112
-
113
-
114
-
115
-
116
-
117
-
118
-
119
-
120
-
121
-
122
-
123
-
124
-
125
-
126
-
127
-
128
-
129
-
130
-
131
-
132
-
133
-
134
-
135
-
136
-
137
-
138
-
139
-
140
-
141
-
142
-
143
-
144
-
145
-
146
-
147
-
148
-
149
-
150
-
151
-
152
-
153
-
154
-
155
-
156
-
157
-
158
-
159
-
160
-
161
-
162
-
163
-
164
-
165
-
166
-
167
-
168
-
169
-
170
-
171
-
172
-
173
-
174
-
175
-
176
-
177
-
178
-
179
-
180
-
181
-
 182
182 -
 183
183 -
 184
184 -
 185
185 -
 186
186 -
 187
187 -
 188
188 -
 189
189 -
 190
190 -
 191
191 -
 192
192 -
 193
193 -
 194
194 -
 195
195 -
 196
196 -
 197
197 -
 198
198 -
 199
199 -
 200
200 -
 201
201 -
 202
202 -
203
-
204
-
205
-
206
-
207
-
208
-
209
-
210
-
211
-
212
-
213
-
214
-
215
-
216
-
217
-
218
-
219
-
220
-
221
-
222
-
223
-
224
-
225
-
226
-
227
-
228
-
229
-
230
-
231
-
232
-
233
-
234
-
235
-
236
-
237
-
238
-
239
-
240
-
241
-
242
-
243
-
244
-
245
-
246
-
247
-
248
-
249
-
250
-
251
-
252
-
253
-
254
-
255
-
256
-
257
-
258
-
259
-
260
-
261
-
262
-
263
-
264
-
265
-
266
-
267
-
268
-
269
-
270
-
271
-
272
-
273
-
274
-
275
-
276
-
277
-
278
-
279
-
280
-
281
-
282
-
283
-
284
-
285
-
286
-
287
-
288
-
289
-
290
-
291
-
292
-
293
-
294
-
295
-
296
-
297
-
298
-
299
-
300
-
301
-
302
-
303
-
304
-
305
-
306
-
307
-
308
-
309
-
310
-
311
-
312
-
313
-
314
-
315
-
316
-
317
-
318
-
319
-
320
-
321
-
322
-
323
-
324
-
325
-
326
-
327
-
328
-
329
-
330
-
331
-
332
-
333
-
334
-
335
 |
 |

Table of Contents
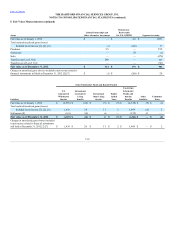
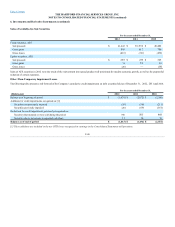
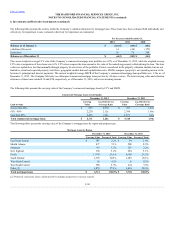
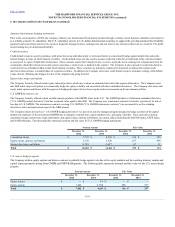
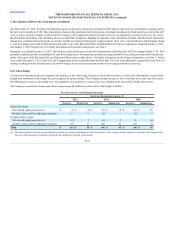
The following table presents the activity within the Company’s valuation allowance for mortgage loans. These loans have been evaluated both individually and
collectively for impairment. Loans evaluated collectively for impairment are immaterial.
(Additions)/Reversals 14 (26) (157)
Deductions 20 79 368
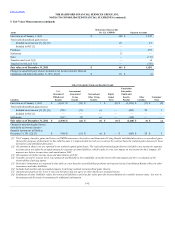
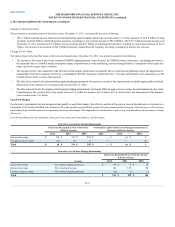
The current weighted-average LTV ratio of the Company’s commercial mortgage loan portfolio was 62% as of December 31, 2012, while the weighted-average
LTV ratio at origination of these loans was 63%. LTV ratios compare the loan amount to the value of the underlying property collateralizing the loan. The loan
values are updated no less than annually through property level reviews of the portfolio. Factors considered in the property valuation include, but are not
limited to, actual and expected property cash flows, geographic market data and capitalization rates. DSCRs compare a property’s net operating income to the
borrower’s principal and interest payments. The current weighted average DSCR of the Company’s commercial mortgage loan portfolio was 2.24x as of
December 31, 2012. The Company held only two delinquent commercial mortgage loans past due by 90 days or more. The total carrying value and valuation
allowance of these loans totaled $32 and $50, respectively, as of December 31, 2012, and are not accruing income.
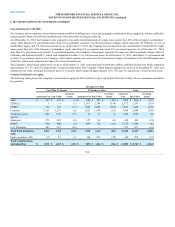
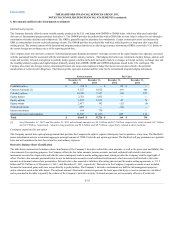
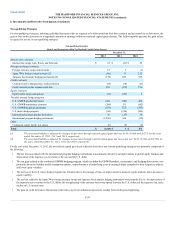
The following table presents the carrying value of the Company’s commercial mortgage loans by LTV and DSCR.
Greater than 80% $ 253 0.95x $ 707 1.45x
65% - 80% 2,220 2.12x 2,384 1.60x
Less than 65% 4,238 2.40x 2,637 2.40x
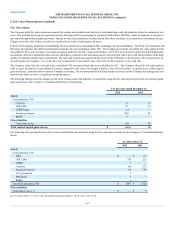
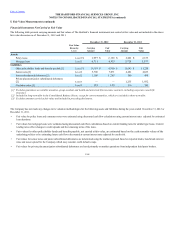
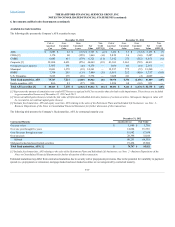
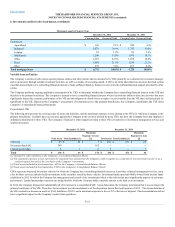
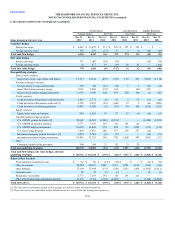
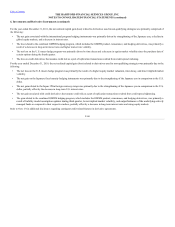
The following tables present the carrying value of the Company’s mortgage loans by region and property type.
East North Central $ 145 2.2%$ 94 1.6%
Middle Atlantic 477 7.1%508 8.9%
Mountain 99 1.5%125 2.2%
New England 350 5.2%294 5.1%
Pacific 1,978 29.5%1,690 29.5%
South Atlantic 1,378 20.5%1,149 20.1%
West North Central 16 0.2%30 0.5%
West South Central 398 5.9%224 3.9%
Other [1] 1,870 27.9%1,614 28.2%
[1] Primarily represents loans collateralized by multiple properties in various regions.
F-50