The Hartford 2012 Annual Report Download - page 122
Download and view the complete annual report
Please find page 122 of the 2012 The Hartford annual report below. You can navigate through the pages in the report by either clicking on the pages listed below, or by using the keyword search tool below to find specific information within the annual report.-
 1
1 -
2
-
3
-
4
-
5
-
6
-
7
-
8
-
9
-
10
-
11
-
12
-
13
-
14
-
15
-
16
-
17
-
18
-
19
-
20
-
21
-
22
-
23
-
24
-
25
-
26
-
27
-
28
-
29
-
30
-
31
-
32
-
33
-
34
-
35
-
36
-
37
-
38
-
39
-
40
-
41
-
42
-
43
-
44
-
45
-
46
-
47
-
48
-
49
-
50
-
51
-
52
-
53
-
54
-
55
-
56
-
57
-
58
-
59
-
60
-
61
-
62
-
63
-
64
-
65
-
66
-
67
-
68
-
69
-
70
-
71
-
72
-
73
-
74
-
75
-
76
-
77
-
78
-
79
-
80
-
81
-
82
-
83
-
84
-
85
-
86
-
87
-
88
-
89
-
90
-
91
-
92
-
93
-
94
-
95
-
96
-
97
-
98
-
99
-
100
-
101
-
102
-
103
-
104
-
105
-
106
-
107
-
108
-
109
-
110
-
111
-
 112
112 -
 113
113 -
 114
114 -
 115
115 -
 116
116 -
 117
117 -
 118
118 -
 119
119 -
 120
120 -
 121
121 -
 122
122 -
 123
123 -
 124
124 -
 125
125 -
 126
126 -
 127
127 -
 128
128 -
 129
129 -
 130
130 -
 131
131 -
 132
132 -
133
-
134
-
135
-
136
-
137
-
138
-
139
-
140
-
141
-
142
-
143
-
144
-
145
-
146
-
147
-
148
-
149
-
150
-
151
-
152
-
153
-
154
-
155
-
156
-
157
-
158
-
159
-
160
-
161
-
162
-
163
-
164
-
165
-
166
-
167
-
168
-
169
-
170
-
171
-
172
-
173
-
174
-
175
-
176
-
177
-
178
-
179
-
180
-
181
-
182
-
183
-
184
-
185
-
186
-
187
-
188
-
189
-
190
-
191
-
192
-
193
-
194
-
195
-
196
-
197
-
198
-
199
-
200
-
201
-
202
-
203
-
204
-
205
-
206
-
207
-
208
-
209
-
210
-
211
-
212
-
213
-
214
-
215
-
216
-
217
-
218
-
219
-
220
-
221
-
222
-
223
-
224
-
225
-
226
-
227
-
228
-
229
-
230
-
231
-
232
-
233
-
234
-
235
-
236
-
237
-
238
-
239
-
240
-
241
-
242
-
243
-
244
-
245
-
246
-
247
-
248
-
249
-
250
-
251
-
252
-
253
-
254
-
255
-
256
-
257
-
258
-
259
-
260
-
261
-
262
-
263
-
264
-
265
-
266
-
267
-
268
-
269
-
270
-
271
-
272
-
273
-
274
-
275
-
276
-
277
-
278
-
279
-
280
-
281
-
282
-
283
-
284
-
285
-
286
-
287
-
288
-
289
-
290
-
291
-
292
-
293
-
294
-
295
-
296
-
297
-
298
-
299
-
300
-
301
-
302
-
303
-
304
-
305
-
306
-
307
-
308
-
309
-
310
-
311
-
312
-
313
-
314
-
315
-
316
-
317
-
318
-
319
-
320
-
321
-
322
-
323
-
324
-
325
-
326
-
327
-
328
-
329
-
330
-
331
-
332
-
333
-
334
-
335
 |
 |

Table of Contents
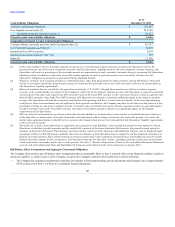
In addition to the credit impairments recognized in earnings, the Company recognized non-credit impairments in other comprehensive income of $ 40 for the
year ended December 31, 2012, predominantly concentrated in corporate financial services and RMBS. These non-credit impairments represent the difference
between fair value and the Company’s best estimate of expected future cash flows discounted at the security’s effective yield prior to impairment, rather than at
current market implied credit spreads. These non-credit impairments primarily represent increases in market liquidity premiums and credit spread widening
that occurred after the securities were purchased, as well as a discount for variable-rate coupons which are paying less than at purchase date. In general, larger
liquidity premiums and wider credit spreads are the result of deterioration of the underlying collateral performance of the securities, as well as the risk
premium required to reflect future uncertainty in the real estate market.
Future impairments may develop as the result of changes in intent to sell specific securities or if actual results underperform current modeling assumptions,
which may be the result of, but are not limited to, macroeconomic factors and security-specific performance below current expectations. Ultimate loss
formation will be a function of macroeconomic factors and idiosyncratic security-specific performance. As a result, it is difficult to predict future impairments
with accuracy.
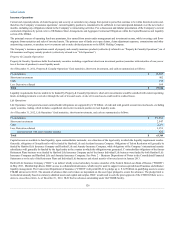
Year ended December 31, 2011
For the year ended December 31, 2011, impairments recognized in earnings were comprised of credit impairments of $ 125, primarily concentrated on
structured securities associated with commercial real estate, as well as direct private investments. Also included were impairments on debt securities for which
the Company intended to sel1 of $32, mainly comprised of corporate bonds, certain ABS aircraft bonds and CMBS as market pricing improved, as well as
impairments on equity securities of $17 primarily related to preferred stock associated with direct private investments.
Year ended December 31, 2010
Impairments recognized in earnings were comprised of credit impairments of $372 primarily concentrated on structured securities associated with commercial
and residential real estate. Also included were impairments on debt securities for which the Company intended to sell of $54, mainly comprised of CMBS
bonds in order to take advantage of price appreciation, as well as impairments on equity securities of $8 primarily on below investment grade securities
depressed 20% for more than six months.
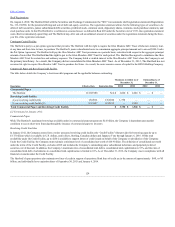
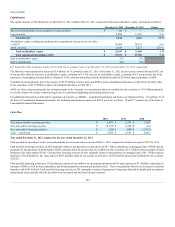
Valuation Allowances on Mortgage Loans
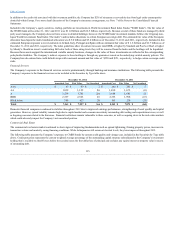
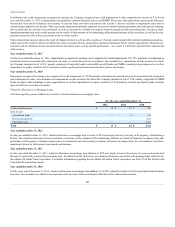
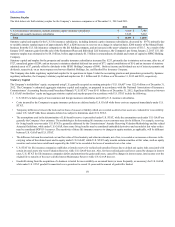
The following table presents (additions)/reversals to valuation allowances on mortgage loans.
Credit-related concerns $14 $ 27 $ (70)
Held for sale
Agricultural loans —(3)(10)
B-note participations — — (22)
Mezzanine loans — — (52)
Year ended December 31, 2012
For the year ended December 31, 2012, valuation allowances on mortgage loan reversals of $14 were largely driven by recovery of the property collateralizing a
B-Note. The valuation allowance was reversed due to an increase in the valuation of the underlying collateral as a result of improved occupancy rates and
performance of the property. Continued improvement in commercial real estate property valuations will positively impact future loss development, with future
impairments driven by idiosyncratic loan-specific performance.
Year ended December 31, 2011
For the year ended December 31, 2011, valuation allowances on mortgage loan additions of $24 were largely driven by the release of a reserve associated with
the sale of a previously reserved for mezzanine loan. Excluded from the table above are valuation allowances associated with mortgage loans related to the
divestiture of Federal Trust Corporation. For further information regarding the divestiture of Federal Trust Corporation, see Note 20 of the Notes to the
Consolidated Financial Statements.
Year ended December 31, 2010
For the years ended December 31, 2010, valuation allowances on mortgage loan additions of $(154), primarily related to B-Note participant and mezzanine
loan sales. Also included were additions for expected credit losses due to borrower financial difficulty and/or collateral deterioration.
121