The Hartford 2012 Annual Report Download - page 210
Download and view the complete annual report
Please find page 210 of the 2012 The Hartford annual report below. You can navigate through the pages in the report by either clicking on the pages listed below, or by using the keyword search tool below to find specific information within the annual report.-
 1
1 -
2
-
3
-
4
-
5
-
6
-
7
-
8
-
9
-
10
-
11
-
12
-
13
-
14
-
15
-
16
-
17
-
18
-
19
-
20
-
21
-
22
-
23
-
24
-
25
-
26
-
27
-
28
-
29
-
30
-
31
-
32
-
33
-
34
-
35
-
36
-
37
-
38
-
39
-
40
-
41
-
42
-
43
-
44
-
45
-
46
-
47
-
48
-
49
-
50
-
51
-
52
-
53
-
54
-
55
-
56
-
57
-
58
-
59
-
60
-
61
-
62
-
63
-
64
-
65
-
66
-
67
-
68
-
69
-
70
-
71
-
72
-
73
-
74
-
75
-
76
-
77
-
78
-
79
-
80
-
81
-
82
-
83
-
84
-
85
-
86
-
87
-
88
-
89
-
90
-
91
-
92
-
93
-
94
-
95
-
96
-
97
-
98
-
99
-
100
-
101
-
102
-
103
-
104
-
105
-
106
-
107
-
108
-
109
-
110
-
111
-
112
-
113
-
114
-
115
-
116
-
117
-
118
-
119
-
120
-
121
-
122
-
123
-
124
-
125
-
126
-
127
-
128
-
129
-
130
-
131
-
132
-
133
-
134
-
135
-
136
-
137
-
138
-
139
-
140
-
141
-
142
-
143
-
144
-
145
-
146
-
147
-
148
-
149
-
150
-
151
-
152
-
153
-
154
-
155
-
156
-
157
-
158
-
159
-
160
-
161
-
162
-
163
-
164
-
165
-
166
-
167
-
168
-
169
-
170
-
171
-
172
-
173
-
174
-
175
-
176
-
177
-
178
-
179
-
180
-
181
-
182
-
183
-
184
-
185
-
186
-
187
-
188
-
189
-
190
-
191
-
192
-
193
-
194
-
195
-
196
-
197
-
198
-
199
-
 200
200 -
 201
201 -
 202
202 -
 203
203 -
 204
204 -
 205
205 -
 206
206 -
 207
207 -
 208
208 -
 209
209 -
 210
210 -
 211
211 -
 212
212 -
 213
213 -
 214
214 -
 215
215 -
 216
216 -
 217
217 -
 218
218 -
 219
219 -
 220
220 -
221
-
222
-
223
-
224
-
225
-
226
-
227
-
228
-
229
-
230
-
231
-
232
-
233
-
234
-
235
-
236
-
237
-
238
-
239
-
240
-
241
-
242
-
243
-
244
-
245
-
246
-
247
-
248
-
249
-
250
-
251
-
252
-
253
-
254
-
255
-
256
-
257
-
258
-
259
-
260
-
261
-
262
-
263
-
264
-
265
-
266
-
267
-
268
-
269
-
270
-
271
-
272
-
273
-
274
-
275
-
276
-
277
-
278
-
279
-
280
-
281
-
282
-
283
-
284
-
285
-
286
-
287
-
288
-
289
-
290
-
291
-
292
-
293
-
294
-
295
-
296
-
297
-
298
-
299
-
300
-
301
-
302
-
303
-
304
-
305
-
306
-
307
-
308
-
309
-
310
-
311
-
312
-
313
-
314
-
315
-
316
-
317
-
318
-
319
-
320
-
321
-
322
-
323
-
324
-
325
-
326
-
327
-
328
-
329
-
330
-
331
-
332
-
333
-
334
-
335
 |
 |

Table of Contents
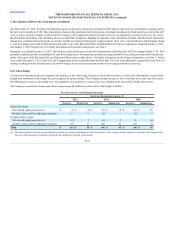
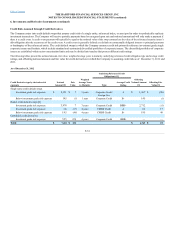
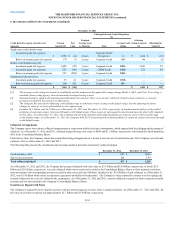
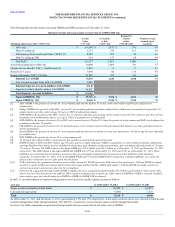
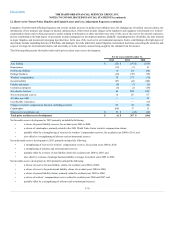
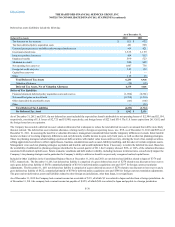
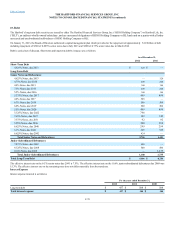
The following table provides details concerning GMDB and GMIB exposure as of December 31, 2012:
MAV only $19,509 $ 3,973 $ 783 69
With 5% rollup [2] 1,517 379 115 69
With Earnings Protection Benefit Rider (“EPB”) [3] 4,990 582 80 66
With 5% rollup & EPB 561 127 28 69
Total MAV 26,577 5,061 1,006
Asset Protection Benefit (“APB”) [4] 20,008 1,069 701 67
Lifetime Income Benefit (“LIB”) – Death Benefit [5] 1,063 33 33 65
Reset [6] (5-7 years) 3,098 140 138 69
Return of Premium (“ROP”) [7]/Other 21,807 327 310 66
Less: General Account Value with U.S. GMDB 7,405
Separate Account Liabilities without U.S. GMDB 76,421
[1] MAV GMDB is the greatest of current AV, net premiums paid and the highest AV on any anniversary before age 80 years (adjusted for
withdrawals).
[2] Rollup GMDB is the greatest of the MAV, current AV, net premium paid and premiums (adjusted for withdrawals) accumulated at generally 5%
simple interest up to the earlier of age 80 years or 100% of adjusted premiums.
[3] EPB GMDB is the greatest of the MAV, current AV, or contract value plus a percentage of the contract’s growth. The contract’s growth is AV less
premiums net of withdrawals, subject to a cap of 200% of premiums net of withdrawals.
[4] APB GMDB is the greater of current AV or MAV, not to exceed current AV plus 25% times the greater of net premiums and MAV (each adjusted for
premiums in the past 12 months).
[5] LIB GMDB is the greatest of current AV, net premiums paid, or for certain contracts a benefit amount that ratchets over time, generally based on
market performance.
[6] Reset GMDB is the greatest of current AV, net premiums paid and the most recent five to seven year anniversary AV before age 80 years (adjusted
for withdrawals).
[7] ROP GMDB is the greater of current AV or net premiums paid.
[8] AV includes the contract holder’s investment in the separate account and the general account.
[9] GMDB includes a ROP and MAV (before age 80 years) paid in a single lump sum. GMIB is a guarantee to return initial investment, adjusted for
earnings liquidity which allows for free withdrawal of earnings, paid through a fixed payout annuity, after a minimum deferral period of 10 years,
15 years or 20 years. The GRB related to the Japan GMIB was $28.6 billion and $34.1 billion as of December 31, 2012 and December 31, 2011,
respectively. The GRB related to the Japan GMAB and GMWB was $578 as of December 31, 2012 and $701 as of December 31, 2011. These
liabilities are not included in the Separate Account as they are not legally insulated from the general account liabilities of the insurance
enterprise. As of December 31, 2012, 55% of the GMDB RNAR and 73% of the GMIB NAR is reinsured to a Hartford affiliate, as a result, the
effects of the reinsurance are not reflected in this disclosure.
[10] NAR is defined as the guaranteed benefit in excess of the current AV. RNAR represents NAR reduced for reinsurance. NAR and RNAR are highly
sensitive to equity markets movements and increase when equity markets decline. Additionally Japan’s NAR and RNAR are highly sensitive to
currency movements and increase when the Yen strengthens.
[11] Policies with a guaranteed living benefit (GMIB in Japan) also have a guaranteed death benefit. The NAR for each benefit is shown in the table
above, however these benefits are not additive. When a policy terminates due to death, any NAR related to GMWB or GMIB is released. Similarly,
when a policy goes into benefit status on a GMWB or GMIB, its GMDB NAR is released.
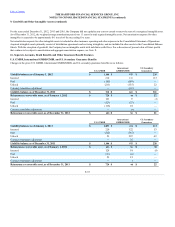
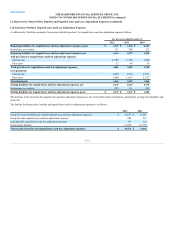
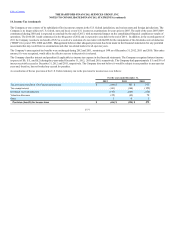
In the U.S., account balances of contracts with guarantees were invested in variable separate accounts as follows:
Equity securities (including mutual funds) $58,208 $61,472
Cash and cash equivalents 6,940 7,516
As of December 31, 2012 and December 31, 2011, approximately 16% and 17%, respectively, of the equity securities above were invested in fixed income
securities through these funds and approximately 84% and 83%, respectively, were invested in equity securities through these funds.
See Note 5 for further information on guaranteed living benefits that are accounted for at fair value, such as GMWB.
F-68