The Hartford 2012 Annual Report Download - page 87
Download and view the complete annual report
Please find page 87 of the 2012 The Hartford annual report below. You can navigate through the pages in the report by either clicking on the pages listed below, or by using the keyword search tool below to find specific information within the annual report.-
 1
1 -
2
-
3
-
4
-
5
-
6
-
7
-
8
-
9
-
10
-
11
-
12
-
13
-
14
-
15
-
16
-
17
-
18
-
19
-
20
-
21
-
22
-
23
-
24
-
25
-
26
-
27
-
28
-
29
-
30
-
31
-
32
-
33
-
34
-
35
-
36
-
37
-
38
-
39
-
40
-
41
-
42
-
43
-
44
-
45
-
46
-
47
-
48
-
49
-
50
-
51
-
52
-
53
-
54
-
55
-
56
-
57
-
58
-
59
-
60
-
61
-
62
-
63
-
64
-
65
-
66
-
67
-
68
-
69
-
70
-
71
-
72
-
73
-
74
-
75
-
76
-
 77
77 -
 78
78 -
 79
79 -
 80
80 -
 81
81 -
 82
82 -
 83
83 -
 84
84 -
 85
85 -
 86
86 -
 87
87 -
 88
88 -
 89
89 -
 90
90 -
 91
91 -
 92
92 -
 93
93 -
 94
94 -
 95
95 -
 96
96 -
 97
97 -
98
-
99
-
100
-
101
-
102
-
103
-
104
-
105
-
106
-
107
-
108
-
109
-
110
-
111
-
112
-
113
-
114
-
115
-
116
-
117
-
118
-
119
-
120
-
121
-
122
-
123
-
124
-
125
-
126
-
127
-
128
-
129
-
130
-
131
-
132
-
133
-
134
-
135
-
136
-
137
-
138
-
139
-
140
-
141
-
142
-
143
-
144
-
145
-
146
-
147
-
148
-
149
-
150
-
151
-
152
-
153
-
154
-
155
-
156
-
157
-
158
-
159
-
160
-
161
-
162
-
163
-
164
-
165
-
166
-
167
-
168
-
169
-
170
-
171
-
172
-
173
-
174
-
175
-
176
-
177
-
178
-
179
-
180
-
181
-
182
-
183
-
184
-
185
-
186
-
187
-
188
-
189
-
190
-
191
-
192
-
193
-
194
-
195
-
196
-
197
-
198
-
199
-
200
-
201
-
202
-
203
-
204
-
205
-
206
-
207
-
208
-
209
-
210
-
211
-
212
-
213
-
214
-
215
-
216
-
217
-
218
-
219
-
220
-
221
-
222
-
223
-
224
-
225
-
226
-
227
-
228
-
229
-
230
-
231
-
232
-
233
-
234
-
235
-
236
-
237
-
238
-
239
-
240
-
241
-
242
-
243
-
244
-
245
-
246
-
247
-
248
-
249
-
250
-
251
-
252
-
253
-
254
-
255
-
256
-
257
-
258
-
259
-
260
-
261
-
262
-
263
-
264
-
265
-
266
-
267
-
268
-
269
-
270
-
271
-
272
-
273
-
274
-
275
-
276
-
277
-
278
-
279
-
280
-
281
-
282
-
283
-
284
-
285
-
286
-
287
-
288
-
289
-
290
-
291
-
292
-
293
-
294
-
295
-
296
-
297
-
298
-
299
-
300
-
301
-
302
-
303
-
304
-
305
-
306
-
307
-
308
-
309
-
310
-
311
-
312
-
313
-
314
-
315
-
316
-
317
-
318
-
319
-
320
-
321
-
322
-
323
-
324
-
325
-
326
-
327
-
328
-
329
-
330
-
331
-
332
-
333
-
334
-
335
 |
 |

Table of Contents
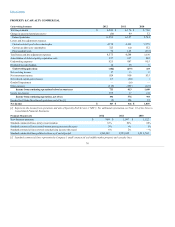
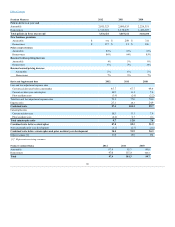
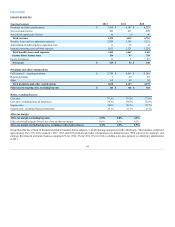
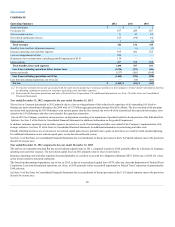
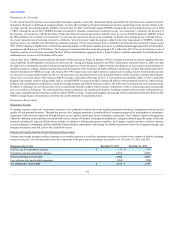
Fee income and other $599 $649 $664
Net investment loss (3)(3)(8)
Net realized capital gains — 1 —
Amortization of deferred policy acquisition costs 35 47 51
Insurance operating costs and other expenses 452 448 458
Income tax expense 38 54 52
Income from discontinued operations, net of tax [1] — — 37
[1] Represents income from discontinued operations, net of tax of Hartford Investments Canada Corporation (“HICC”). For additional information, see
Note 20 of the Notes to Consolidated Financial Statements.
Retail mutual fund assets $43,149 $40,228 $ 48,753
Investment only mutual fund assets 16,598 16,140 16,634
Other plan assets 1,864 1,557 1,472
Mutual fund assets 61,611 57,925 66,859
Annuity mutual fund assets 26,036 27,613 33,627
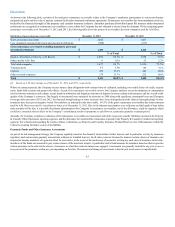
AUM, beginning of period $40,228 $ 48,753 $ 42,829
Sales 8,559 10,876 12,732
Redemptions (10,947)(16,431)(11,703)
Change in market value and other 5,309 (2,970) 4,895
Effect of restructuring, net of tax 0.3 — —
Effect of net realized gains, net of tax and DAC — — 3.9
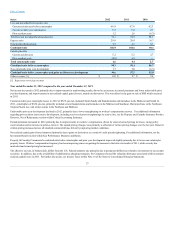
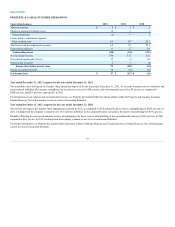
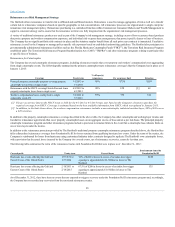
Year ended December 31, 2012 compared to the year ended December 31, 2011
Net income, as compared to the prior year period, decreased for the year ended December 31, 2012 primarily due to lower fee income and other driven by lower
average AUM and higher distribution and marketing expenses in 2012 compared to 2011. AUM increased modestly reflecting the improving performance of
the Company's mutual funds in the equity markets largely offset by negative net flows primarily in mutual funds supporting the Company's variable annuity
products. Retail net outflows decreased in 2012 compared to 2011 as redemption rates continued to trend lower compared to 2011, although new business sales
activity decreased in 2012 compared to 2011. Total AUM is expected to be impacted by a planned redemption of approximately $1.5 billion in the second
quarter of 2013.
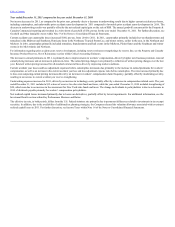
Year ended December 31, 2011 compared to the year ended December 31, 2010
Net income decreased in 2011 primarily due to discontinued operations. The decline in income from discontinued operations in 2011 compared to 2010 is due
to the sale of the Canadian mutual fund operations, which closed in December 2010. Net income from continuing operations increased compared to 2010 due
to a decline in expenses largely due to a capital infusion to the Money Market Funds in the third quarter of 2010.
86