The Hartford 2012 Annual Report Download - page 167
Download and view the complete annual report
Please find page 167 of the 2012 The Hartford annual report below. You can navigate through the pages in the report by either clicking on the pages listed below, or by using the keyword search tool below to find specific information within the annual report.-
 1
1 -
2
-
3
-
4
-
5
-
6
-
7
-
8
-
9
-
10
-
11
-
12
-
13
-
14
-
15
-
16
-
17
-
18
-
19
-
20
-
21
-
22
-
23
-
24
-
25
-
26
-
27
-
28
-
29
-
30
-
31
-
32
-
33
-
34
-
35
-
36
-
37
-
38
-
39
-
40
-
41
-
42
-
43
-
44
-
45
-
46
-
47
-
48
-
49
-
50
-
51
-
52
-
53
-
54
-
55
-
56
-
57
-
58
-
59
-
60
-
61
-
62
-
63
-
64
-
65
-
66
-
67
-
68
-
69
-
70
-
71
-
72
-
73
-
74
-
75
-
76
-
77
-
78
-
79
-
80
-
81
-
82
-
83
-
84
-
85
-
86
-
87
-
88
-
89
-
90
-
91
-
92
-
93
-
94
-
95
-
96
-
97
-
98
-
99
-
100
-
101
-
102
-
103
-
104
-
105
-
106
-
107
-
108
-
109
-
110
-
111
-
112
-
113
-
114
-
115
-
116
-
117
-
118
-
119
-
120
-
121
-
122
-
123
-
124
-
125
-
126
-
127
-
128
-
129
-
130
-
131
-
132
-
133
-
134
-
135
-
136
-
137
-
138
-
139
-
140
-
141
-
142
-
143
-
144
-
145
-
146
-
147
-
148
-
149
-
150
-
151
-
152
-
153
-
154
-
155
-
156
-
 157
157 -
 158
158 -
 159
159 -
 160
160 -
 161
161 -
 162
162 -
 163
163 -
 164
164 -
 165
165 -
 166
166 -
 167
167 -
 168
168 -
 169
169 -
 170
170 -
 171
171 -
 172
172 -
 173
173 -
 174
174 -
 175
175 -
 176
176 -
 177
177 -
178
-
179
-
180
-
181
-
182
-
183
-
184
-
185
-
186
-
187
-
188
-
189
-
190
-
191
-
192
-
193
-
194
-
195
-
196
-
197
-
198
-
199
-
200
-
201
-
202
-
203
-
204
-
205
-
206
-
207
-
208
-
209
-
210
-
211
-
212
-
213
-
214
-
215
-
216
-
217
-
218
-
219
-
220
-
221
-
222
-
223
-
224
-
225
-
226
-
227
-
228
-
229
-
230
-
231
-
232
-
233
-
234
-
235
-
236
-
237
-
238
-
239
-
240
-
241
-
242
-
243
-
244
-
245
-
246
-
247
-
248
-
249
-
250
-
251
-
252
-
253
-
254
-
255
-
256
-
257
-
258
-
259
-
260
-
261
-
262
-
263
-
264
-
265
-
266
-
267
-
268
-
269
-
270
-
271
-
272
-
273
-
274
-
275
-
276
-
277
-
278
-
279
-
280
-
281
-
282
-
283
-
284
-
285
-
286
-
287
-
288
-
289
-
290
-
291
-
292
-
293
-
294
-
295
-
296
-
297
-
298
-
299
-
300
-
301
-
302
-
303
-
304
-
305
-
306
-
307
-
308
-
309
-
310
-
311
-
312
-
313
-
314
-
315
-
316
-
317
-
318
-
319
-
320
-
321
-
322
-
323
-
324
-
325
-
326
-
327
-
328
-
329
-
330
-
331
-
332
-
333
-
334
-
335
 |
 |

Table of Contents
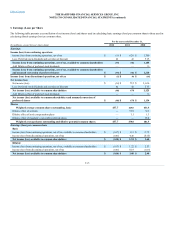
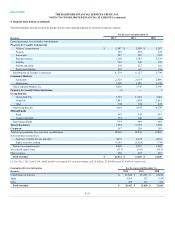
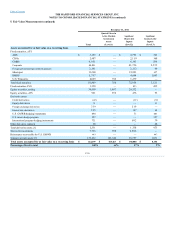
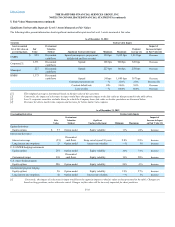
The following table presents revenues by product line for each reporting segment, as well as the Corporate category.
Earned premiums, fees, and other considerations
Workers’ compensation $2,987 $2,809 $ 2,387
Property 505 528 547
Automobile 587 583 598
Package business 1,160 1,145 1,124
Liability 562 540 540
Fidelity and surety 205 215 224
Professional liability 253 307 324
Total Property & Casualty Commercial 6,259 6,127 5,744
Automobile 2,526 2,619 2,806
Homeowners 1,110 1,128 1,141
Total Consumer Markets [1] 3,636 3,747 3,947
(2) — 1
Group disability 1,735 1,929 2,004
Group life 1,881 2,024 2,052
Other 194 194 222
Total Group Benefits 3,810 4,147 4,278
Retail 487 541 561
Annuity and other 112 108 103
Total Mutual Funds 599 649 664
3,594 3,959 3,980
167 209 189
Total earned premiums, fees, and other considerations 18,063 18,838 18,803
Net investment income (loss):
Securities available-for-sale and other 4,237 4,272 4,364
Equity securities, trading 4,565 (1,359)(774)
Total net investment income 8,802 2,913 3,590
Net realized capital losses (711)(145)(611)
Other revenues 258 253 267
[1] For 2012, 2011 and 2010, AARP members accounted for earned premiums of $2.8 billion, $2.8 billion and $2.9 billion, respectively.
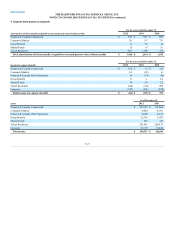
United States of America $ 21,814 $ 21,561 $22,140
Japan 4,363 135 (329)
Other 235 163 238
F-26