The Hartford 2012 Annual Report Download - page 177
Download and view the complete annual report
Please find page 177 of the 2012 The Hartford annual report below. You can navigate through the pages in the report by either clicking on the pages listed below, or by using the keyword search tool below to find specific information within the annual report.-
 1
1 -
2
-
3
-
4
-
5
-
6
-
7
-
8
-
9
-
10
-
11
-
12
-
13
-
14
-
15
-
16
-
17
-
18
-
19
-
20
-
21
-
22
-
23
-
24
-
25
-
26
-
27
-
28
-
29
-
30
-
31
-
32
-
33
-
34
-
35
-
36
-
37
-
38
-
39
-
40
-
41
-
42
-
43
-
44
-
45
-
46
-
47
-
48
-
49
-
50
-
51
-
52
-
53
-
54
-
55
-
56
-
57
-
58
-
59
-
60
-
61
-
62
-
63
-
64
-
65
-
66
-
67
-
68
-
69
-
70
-
71
-
72
-
73
-
74
-
75
-
76
-
77
-
78
-
79
-
80
-
81
-
82
-
83
-
84
-
85
-
86
-
87
-
88
-
89
-
90
-
91
-
92
-
93
-
94
-
95
-
96
-
97
-
98
-
99
-
100
-
101
-
102
-
103
-
104
-
105
-
106
-
107
-
108
-
109
-
110
-
111
-
112
-
113
-
114
-
115
-
116
-
117
-
118
-
119
-
120
-
121
-
122
-
123
-
124
-
125
-
126
-
127
-
128
-
129
-
130
-
131
-
132
-
133
-
134
-
135
-
136
-
137
-
138
-
139
-
140
-
141
-
142
-
143
-
144
-
145
-
146
-
147
-
148
-
149
-
150
-
151
-
152
-
153
-
154
-
155
-
156
-
157
-
158
-
159
-
160
-
161
-
162
-
163
-
164
-
165
-
166
-
 167
167 -
 168
168 -
 169
169 -
 170
170 -
 171
171 -
 172
172 -
 173
173 -
 174
174 -
 175
175 -
 176
176 -
 177
177 -
 178
178 -
 179
179 -
 180
180 -
 181
181 -
 182
182 -
 183
183 -
 184
184 -
 185
185 -
 186
186 -
 187
187 -
188
-
189
-
190
-
191
-
192
-
193
-
194
-
195
-
196
-
197
-
198
-
199
-
200
-
201
-
202
-
203
-
204
-
205
-
206
-
207
-
208
-
209
-
210
-
211
-
212
-
213
-
214
-
215
-
216
-
217
-
218
-
219
-
220
-
221
-
222
-
223
-
224
-
225
-
226
-
227
-
228
-
229
-
230
-
231
-
232
-
233
-
234
-
235
-
236
-
237
-
238
-
239
-
240
-
241
-
242
-
243
-
244
-
245
-
246
-
247
-
248
-
249
-
250
-
251
-
252
-
253
-
254
-
255
-
256
-
257
-
258
-
259
-
260
-
261
-
262
-
263
-
264
-
265
-
266
-
267
-
268
-
269
-
270
-
271
-
272
-
273
-
274
-
275
-
276
-
277
-
278
-
279
-
280
-
281
-
282
-
283
-
284
-
285
-
286
-
287
-
288
-
289
-
290
-
291
-
292
-
293
-
294
-
295
-
296
-
297
-
298
-
299
-
300
-
301
-
302
-
303
-
304
-
305
-
306
-
307
-
308
-
309
-
310
-
311
-
312
-
313
-
314
-
315
-
316
-
317
-
318
-
319
-
320
-
321
-
322
-
323
-
324
-
325
-
326
-
327
-
328
-
329
-
330
-
331
-
332
-
333
-
334
-
335
 |
 |

Table of Contents
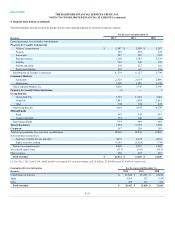
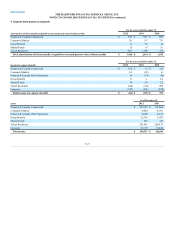
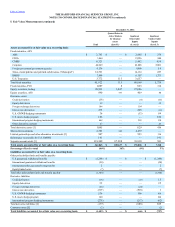
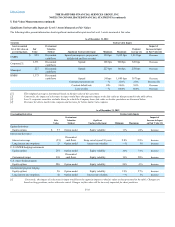
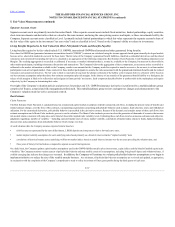
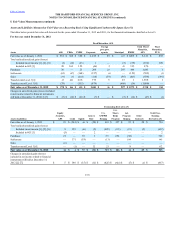
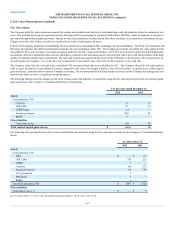
Significant Unobservable Inputs for Level 3 Assets Measured at Fair Values
The following tables present information about significant unobservable inputs used in Level 3 assets measured at fair value.
CMBS $859 Discounted
cash flows
Spread (encompasses prepayment,
default risk and loss severity)
320 bps 3,615 bps 1,031 bps Decrease
Corporate [3] 1,371 Discounted
cash flows
Spread 106 bps 900 bps 328 bps Decrease
Municipal 227 Discounted
cash flows
Spread 227 bps 344 bps 258 bps Decrease
RMBS 1,373 Discounted
cash flows Spread 54 bps 1,689 bps 367 bps Decrease
Constant prepayment rate —% 12.0% 2.0% Decrease [4]
Constant default rate 1.0% 24.0% 8.0% Decrease
Loss severity —% 100.0% 80.0% Decrease
[1] The weighted average is determined based on the fair value of the securities.
[2] Conversely, the impact of a decrease in input would have the opposite impact to the fair value as that presented in the table above.
[3] Level 3 corporate securities excludes those for which the Company bases fair value on broker quotations as discussed below.
[4] Decrease for above market rate coupons and increase for below market rate coupons.
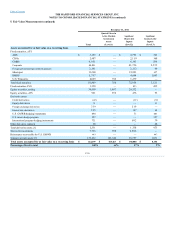
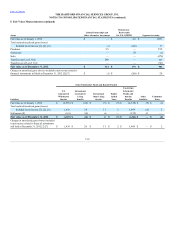
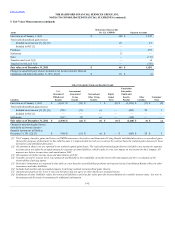
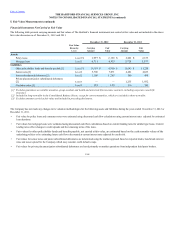
Equity derivatives
Equity options $57 Option model Equity volatility 13%24%Increase
Interest rate derivative
Interest rate swaps (55)
Discounted
cash flows Swap curve beyond 30 years 2.8%2.8%Increase
Long interest rate swaptions 23 Option model Interest rate volatility —%1%Increase
U.S. GMWB hedging instruments
Equity options 281 Option model Equity volatility 10%31%Increase
Customized swaps 238
Discounted
cash flows Equity volatility 10%50%Increase
U.S. macro hedge program
Equity options 286 Option model Equity volatility 24%43%Increase
International program hedging
Equity options 26 Option model Equity volatility 19%27%Increase
Long interest rate swaptions 42 Option model Interest rate volatility —%1%Increase
[1] Conversely, the impact of a decrease in input would have the opposite impact to the fair value as that presented in the table. Changes are
based on long positions, unless otherwise noted. Changes in fair value will be inversely impacted for short positions.
F-35