The Hartford 2012 Annual Report Download - page 189
Download and view the complete annual report
Please find page 189 of the 2012 The Hartford annual report below. You can navigate through the pages in the report by either clicking on the pages listed below, or by using the keyword search tool below to find specific information within the annual report.-
 1
1 -
2
-
3
-
4
-
5
-
6
-
7
-
8
-
9
-
10
-
11
-
12
-
13
-
14
-
15
-
16
-
17
-
18
-
19
-
20
-
21
-
22
-
23
-
24
-
25
-
26
-
27
-
28
-
29
-
30
-
31
-
32
-
33
-
34
-
35
-
36
-
37
-
38
-
39
-
40
-
41
-
42
-
43
-
44
-
45
-
46
-
47
-
48
-
49
-
50
-
51
-
52
-
53
-
54
-
55
-
56
-
57
-
58
-
59
-
60
-
61
-
62
-
63
-
64
-
65
-
66
-
67
-
68
-
69
-
70
-
71
-
72
-
73
-
74
-
75
-
76
-
77
-
78
-
79
-
80
-
81
-
82
-
83
-
84
-
85
-
86
-
87
-
88
-
89
-
90
-
91
-
92
-
93
-
94
-
95
-
96
-
97
-
98
-
99
-
100
-
101
-
102
-
103
-
104
-
105
-
106
-
107
-
108
-
109
-
110
-
111
-
112
-
113
-
114
-
115
-
116
-
117
-
118
-
119
-
120
-
121
-
122
-
123
-
124
-
125
-
126
-
127
-
128
-
129
-
130
-
131
-
132
-
133
-
134
-
135
-
136
-
137
-
138
-
139
-
140
-
141
-
142
-
143
-
144
-
145
-
146
-
147
-
148
-
149
-
150
-
151
-
152
-
153
-
154
-
155
-
156
-
157
-
158
-
159
-
160
-
161
-
162
-
163
-
164
-
165
-
166
-
167
-
168
-
169
-
170
-
171
-
172
-
173
-
174
-
175
-
176
-
177
-
178
-
 179
179 -
 180
180 -
 181
181 -
 182
182 -
 183
183 -
 184
184 -
 185
185 -
 186
186 -
 187
187 -
 188
188 -
 189
189 -
 190
190 -
 191
191 -
 192
192 -
 193
193 -
 194
194 -
 195
195 -
 196
196 -
 197
197 -
 198
198 -
 199
199 -
200
-
201
-
202
-
203
-
204
-
205
-
206
-
207
-
208
-
209
-
210
-
211
-
212
-
213
-
214
-
215
-
216
-
217
-
218
-
219
-
220
-
221
-
222
-
223
-
224
-
225
-
226
-
227
-
228
-
229
-
230
-
231
-
232
-
233
-
234
-
235
-
236
-
237
-
238
-
239
-
240
-
241
-
242
-
243
-
244
-
245
-
246
-
247
-
248
-
249
-
250
-
251
-
252
-
253
-
254
-
255
-
256
-
257
-
258
-
259
-
260
-
261
-
262
-
263
-
264
-
265
-
266
-
267
-
268
-
269
-
270
-
271
-
272
-
273
-
274
-
275
-
276
-
277
-
278
-
279
-
280
-
281
-
282
-
283
-
284
-
285
-
286
-
287
-
288
-
289
-
290
-
291
-
292
-
293
-
294
-
295
-
296
-
297
-
298
-
299
-
300
-
301
-
302
-
303
-
304
-
305
-
306
-
307
-
308
-
309
-
310
-
311
-
312
-
313
-
314
-
315
-
316
-
317
-
318
-
319
-
320
-
321
-
322
-
323
-
324
-
325
-
326
-
327
-
328
-
329
-
330
-
331
-
332
-
333
-
334
-
335
 |
 |

Table of Contents
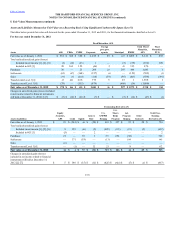
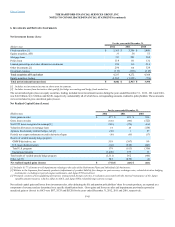
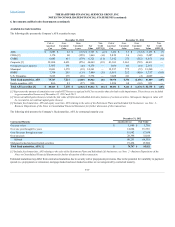
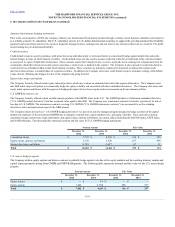
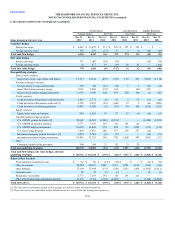
The following table presents the Company’s AFS securities by type.
ABS $ 2,883 $ 63 $ (183) $ 2,763 $(4) $ 3,430 $55 $(332) $ 3,153 $ (7)
CDOs [2] 3,170 60 (159)3,040 (14)2,819 16 (348) 2,487 (44)
CMBS 6,083 417 (179) 6,321 (11)7,192 271 (512) 6,951 (31)
Corporate [2] 39,694 4,631 (276) 44,049 (19) 41,161 3,661 (739)44,011 —
Foreign govt./govt. agencies 3,985 191 (40) 4,136 — 2,030 141 (10)2,161 —
Municipal 13,001 1,379 (19) 14,361 — 12,557 775 (72) 13,260 —
RMBS 7,318 295 (133)7,480 (32)5,961 252 (456) 5,757 (105)
U.S. Treasuries 3,613 175 (16) 3,772 — 3,828 203 (2) 4,029 —
Equity securities, AFS 866 81 (57) 890 — 1,056 68 (203)921 —
[1] Represents the amount of cumulative non-credit OTTI losses recognized in OCI on securities that also had credit impairments. These losses are included
in gross unrealized losses as of December 31, 2012 and 2011.
[2] Gross unrealized gains (losses) exclude the fair value of bifurcated embedded derivative features of certain securities. Subsequent changes in value will
be recorded in net realized capital gains (losses).
[3] Includes fixed maturities, AFS and equity securities, AFS relating to the sales of the Retirement Plans and Individual Life businesses; see Note 2 -
Business Dispositions of the Notes to Consolidated Financial Statements for further discussion of this transaction.
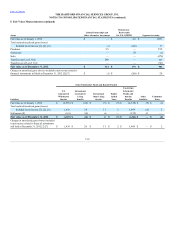
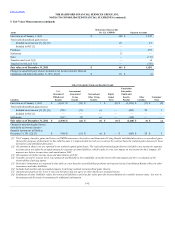
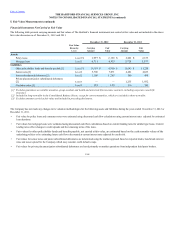
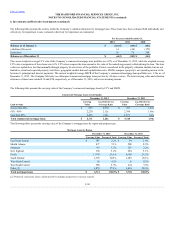
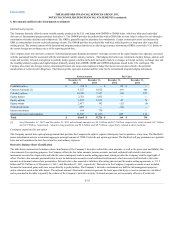
The following table presents the Company’s fixed maturities, AFS, by contractual maturity year.
One year or less $1,689 $ 1,710
Over one year through five years 14,664 15,556
Over five years through ten years 15,542 17,038
Over ten years 28,398 32,014
Subtotal 60,293 66,318
Mortgage-backed and asset-backed securities 19,454 19,604
[1] Includes fixed maturities, AFS relating to the sales of the Retirement Plans and Individual Life businesses; see Note 2 - Business Dispositions of the
Notes to Consolidated Financial Statements for further discussion of this transaction.
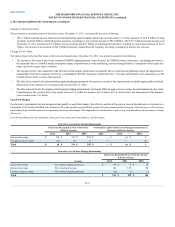
Estimated maturities may differ from contractual maturities due to security call or prepayment provisions. Due to the potential for variability in payment
spreads (i.e. prepayments or extensions), mortgage-backed and asset-backed securities are not categorized by contractual maturity.
F-47