The Hartford 2012 Annual Report Download - page 115
Download and view the complete annual report
Please find page 115 of the 2012 The Hartford annual report below. You can navigate through the pages in the report by either clicking on the pages listed below, or by using the keyword search tool below to find specific information within the annual report.-
 1
1 -
2
-
3
-
4
-
5
-
6
-
7
-
8
-
9
-
10
-
11
-
12
-
13
-
14
-
15
-
16
-
17
-
18
-
19
-
20
-
21
-
22
-
23
-
24
-
25
-
26
-
27
-
28
-
29
-
30
-
31
-
32
-
33
-
34
-
35
-
36
-
37
-
38
-
39
-
40
-
41
-
42
-
43
-
44
-
45
-
46
-
47
-
48
-
49
-
50
-
51
-
52
-
53
-
54
-
55
-
56
-
57
-
58
-
59
-
60
-
61
-
62
-
63
-
64
-
65
-
66
-
67
-
68
-
69
-
70
-
71
-
72
-
73
-
74
-
75
-
76
-
77
-
78
-
79
-
80
-
81
-
82
-
83
-
84
-
85
-
86
-
87
-
88
-
89
-
90
-
91
-
92
-
93
-
94
-
95
-
96
-
97
-
98
-
99
-
100
-
101
-
102
-
103
-
104
-
 105
105 -
 106
106 -
 107
107 -
 108
108 -
 109
109 -
 110
110 -
 111
111 -
 112
112 -
 113
113 -
 114
114 -
 115
115 -
 116
116 -
 117
117 -
 118
118 -
 119
119 -
 120
120 -
 121
121 -
 122
122 -
 123
123 -
 124
124 -
 125
125 -
126
-
127
-
128
-
129
-
130
-
131
-
132
-
133
-
134
-
135
-
136
-
137
-
138
-
139
-
140
-
141
-
142
-
143
-
144
-
145
-
146
-
147
-
148
-
149
-
150
-
151
-
152
-
153
-
154
-
155
-
156
-
157
-
158
-
159
-
160
-
161
-
162
-
163
-
164
-
165
-
166
-
167
-
168
-
169
-
170
-
171
-
172
-
173
-
174
-
175
-
176
-
177
-
178
-
179
-
180
-
181
-
182
-
183
-
184
-
185
-
186
-
187
-
188
-
189
-
190
-
191
-
192
-
193
-
194
-
195
-
196
-
197
-
198
-
199
-
200
-
201
-
202
-
203
-
204
-
205
-
206
-
207
-
208
-
209
-
210
-
211
-
212
-
213
-
214
-
215
-
216
-
217
-
218
-
219
-
220
-
221
-
222
-
223
-
224
-
225
-
226
-
227
-
228
-
229
-
230
-
231
-
232
-
233
-
234
-
235
-
236
-
237
-
238
-
239
-
240
-
241
-
242
-
243
-
244
-
245
-
246
-
247
-
248
-
249
-
250
-
251
-
252
-
253
-
254
-
255
-
256
-
257
-
258
-
259
-
260
-
261
-
262
-
263
-
264
-
265
-
266
-
267
-
268
-
269
-
270
-
271
-
272
-
273
-
274
-
275
-
276
-
277
-
278
-
279
-
280
-
281
-
282
-
283
-
284
-
285
-
286
-
287
-
288
-
289
-
290
-
291
-
292
-
293
-
294
-
295
-
296
-
297
-
298
-
299
-
300
-
301
-
302
-
303
-
304
-
305
-
306
-
307
-
308
-
309
-
310
-
311
-
312
-
313
-
314
-
315
-
316
-
317
-
318
-
319
-
320
-
321
-
322
-
323
-
324
-
325
-
326
-
327
-
328
-
329
-
330
-
331
-
332
-
333
-
334
-
335
 |
 |

Table of Contents
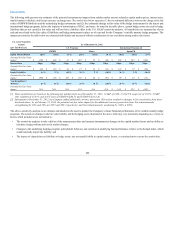
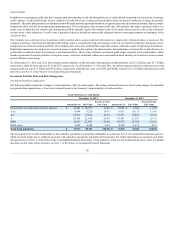
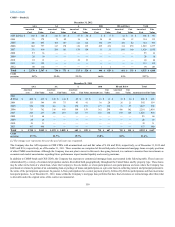
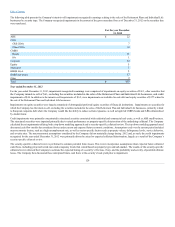
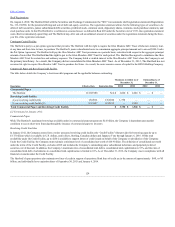
The following tables present the Company’s European securities included in the Securities by Type table above.
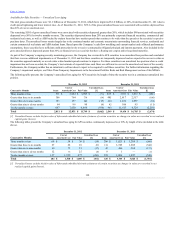
Italy $4$4$ — $ — $ — $ — $ 4$4
Spain [3] 53 52 20 20 — — 73 72
Ireland 143 145 — — — — 143 145
Portugal —— — — — — — —
Greece —— — — — — — —
200
4,022
$ 4,222
Italy $314 $255 $ — $ — $ — $ — $ 314 $255
Spain [3] 191 189 20 19 — — 211 208
Ireland 163 162 — — — — 163 162
Portugal 15 15 — — — — 15 15
Greece — — — — — — — —
[1] Includes amortized cost and fair value of $74 as of December 31, 2012 and $67 as of December 31, 2011 related to limited partnerships and other
alternative investments, the majority of which is domiciled in the United Kingdom.
[2] Includes a notional amount and fair value of $384 and $(3), respectively, as of December 31, 2012 and $697 and $27, respectively, as of
December 31, 2011 related to credit default swap protection. This includes a notional amount of $56 and $89 as of December 31, 2012 and
December 31, 2011, respectively, related to single name corporate issuers in the financial services sector.
[3] The Company has credit default swap protection with a notional amount of $ 20 related to the Corporate and Equity, AFS Financial Services.
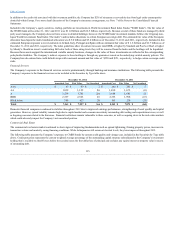
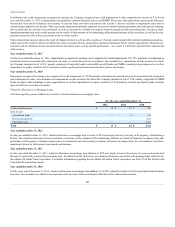
The Company’s European investment exposure largely relates to corporate entities which are domiciled in or generated a significant portion of its revenue
within the United Kingdom, Germany, the Netherlands and Switzerland. As of December 31, 2012 and 2011, exposure to the United Kingdom totals less
than 2% of total invested assets. The majority of investments are U.S. dollar-denominated, and those securities that are pound and euro-denominated are
hedged to U.S. dollars or support foreign-denominated liabilities. For a discussion of foreign currency risks, see the Foreign Currency Exchange Risk section
of this MD&A. The Company does not hold any sovereign exposure to the higher risk countries and does not hold any exposure to issuers in Greece. As of
December 31, 2012 and 2011, the Company’s unfunded commitments associated with its investment portfolio was immaterial, and the weighted average
credit quality of European investments was A- and A, respectively.
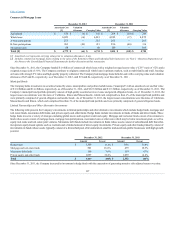
As of December 31, 2012 and 2011, the Company’s total credit default swaps that provide credit protection on European issuers had a notional amount of
$384 and $697, respectively, and a fair value of $(3) and $27, respectively. Included in those notional amounts as of December 31, 2012 and 2011 were
$384 and $407, respectively, on credit default swaps that reference single name corporate and financial European issuers, of which $ 23 and $125,
respectively, relate to the higher risk countries. The maturity dates of credit defaults swaps are primarily consistent with the hedged bonds. Also included are
credit default swaps with a notional amount of $290 as of December 31, 2011 which reference a standard basket of European corporate and financial issuers.
For further information on the use of the Company’s credit derivatives and counterparty credit quality, see Derivative Instruments within the Credit Risk
section of this MD&A.
114