The Hartford 2012 Annual Report Download - page 243
Download and view the complete annual report
Please find page 243 of the 2012 The Hartford annual report below. You can navigate through the pages in the report by either clicking on the pages listed below, or by using the keyword search tool below to find specific information within the annual report.-
 1
1 -
2
-
3
-
4
-
5
-
6
-
7
-
8
-
9
-
10
-
11
-
12
-
13
-
14
-
15
-
16
-
17
-
18
-
19
-
20
-
21
-
22
-
23
-
24
-
25
-
26
-
27
-
28
-
29
-
30
-
31
-
32
-
33
-
34
-
35
-
36
-
37
-
38
-
39
-
40
-
41
-
42
-
43
-
44
-
45
-
46
-
47
-
48
-
49
-
50
-
51
-
52
-
53
-
54
-
55
-
56
-
57
-
58
-
59
-
60
-
61
-
62
-
63
-
64
-
65
-
66
-
67
-
68
-
69
-
70
-
71
-
72
-
73
-
74
-
75
-
76
-
77
-
78
-
79
-
80
-
81
-
82
-
83
-
84
-
85
-
86
-
87
-
88
-
89
-
90
-
91
-
92
-
93
-
94
-
95
-
96
-
97
-
98
-
99
-
100
-
101
-
102
-
103
-
104
-
105
-
106
-
107
-
108
-
109
-
110
-
111
-
112
-
113
-
114
-
115
-
116
-
117
-
118
-
119
-
120
-
121
-
122
-
123
-
124
-
125
-
126
-
127
-
128
-
129
-
130
-
131
-
132
-
133
-
134
-
135
-
136
-
137
-
138
-
139
-
140
-
141
-
142
-
143
-
144
-
145
-
146
-
147
-
148
-
149
-
150
-
151
-
152
-
153
-
154
-
155
-
156
-
157
-
158
-
159
-
160
-
161
-
162
-
163
-
164
-
165
-
166
-
167
-
168
-
169
-
170
-
171
-
172
-
173
-
174
-
175
-
176
-
177
-
178
-
179
-
180
-
181
-
182
-
183
-
184
-
185
-
186
-
187
-
188
-
189
-
190
-
191
-
192
-
193
-
194
-
195
-
196
-
197
-
198
-
199
-
200
-
201
-
202
-
203
-
204
-
205
-
206
-
207
-
208
-
209
-
210
-
211
-
212
-
213
-
214
-
215
-
216
-
217
-
218
-
219
-
220
-
221
-
222
-
223
-
224
-
225
-
226
-
227
-
228
-
229
-
230
-
231
-
232
-
 233
233 -
 234
234 -
 235
235 -
 236
236 -
 237
237 -
 238
238 -
 239
239 -
 240
240 -
 241
241 -
 242
242 -
 243
243 -
 244
244 -
 245
245 -
 246
246 -
 247
247 -
 248
248 -
 249
249 -
 250
250 -
 251
251 -
 252
252 -
 253
253 -
254
-
255
-
256
-
257
-
258
-
259
-
260
-
261
-
262
-
263
-
264
-
265
-
266
-
267
-
268
-
269
-
270
-
271
-
272
-
273
-
274
-
275
-
276
-
277
-
278
-
279
-
280
-
281
-
282
-
283
-
284
-
285
-
286
-
287
-
288
-
289
-
290
-
291
-
292
-
293
-
294
-
295
-
296
-
297
-
298
-
299
-
300
-
301
-
302
-
303
-
304
-
305
-
306
-
307
-
308
-
309
-
310
-
311
-
312
-
313
-
314
-
315
-
316
-
317
-
318
-
319
-
320
-
321
-
322
-
323
-
324
-
325
-
326
-
327
-
328
-
329
-
330
-
331
-
332
-
333
-
334
-
335
 |
 |

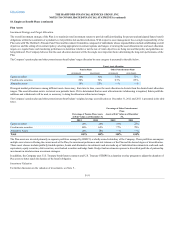
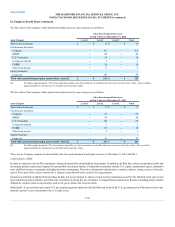
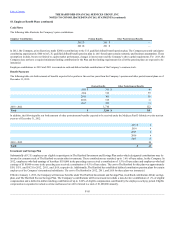
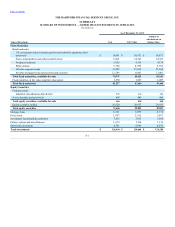
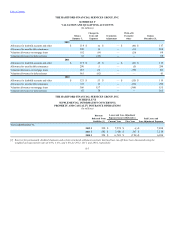
Changes in the accrued restructuring and other costs liability balance included in other liabilities in the Consolidated Balance Sheets are as follows:
$ 12 $ — $ — $ 5 $ 17
Accruals/provisions 148 44 5 2 199
Payments/write-offs (90)(44) (5) (7)(146)
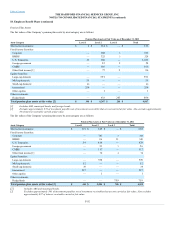
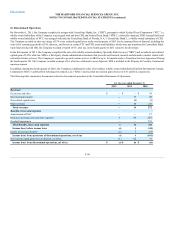
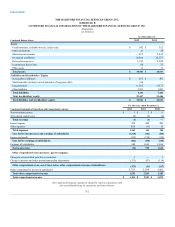
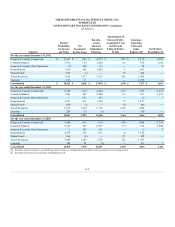
Revenues $7,661 $6,300 $ 4,574 $ 5,401 $ 6,442 $ 4,520 $ 7,735 $5,638
Benefits, losses and expenses 7,659 5,913 4,823 5,551 6,464 4,537 7,993 5,557
Income (loss) from continuing operations, net of tax 97 339 (100)113 15 57 (45)117
Income (loss) from discontinued operations, net of tax (1)162 (1)(80)(2)3(1) 1
Net income (loss) 96 501 (101)33 13 60 (46)118
Less: Preferred stock dividends and accretion of discount 10 10 11 11 10 10 11 11
Net income (loss) available to common shareholders [1] $86 $ 491 $ (112) $ 22 $ 3$ 50 $ (57) $ 107
Basic earnings (losses) per common share $0.20 $1.10 $(0.26) $ 0.05 $0.01 $0.11 $(0.13) $ 0.24
Diluted earnings (losses) per common share [1] $0.18 $0.99 $(0.26) $ 0.05 $0.01 $0.11 $(0.13) $ 0.23
Weighted average common shares outstanding, basic 440.7 444.6 438.2 445.1 435.8 445.3 436.2 445.1
Weighted average shares outstanding and dilutive potential
common shares 469.0 508.2 438.2 482.4 461.7 473.4 436.2 468.9
[1] In periods of a net loss available to common shareholders, the Company uses basic weighted average common shares outstanding in the calculation of
diluted loss per common share, since the inclusion of shares for warrants, stock compensation plans and the assumed conversion of the preferred
shares to common would have been antidilutive to the earnings (loss) per common share calculation. In the absence of the net loss available to
common shareholders, weighted average common shares outstanding and dilutive potential common shares would have totaled 485.8 million and
488.9 million for the three months ended June 30, 2012 and December 31, 2012, respectively. In addition, assuming the impact of mandatory
convertible preferred shares was not antidilutive, weighted average common shares outstanding and dilutive potential common shares would have
totaled 489.9 million, 482.7 million, 489.6 million, 494.1 million and 503.1 million for the three months ended March 31, 2012, September 30, 2012
December 31, 2011, September 30, 2011 and June 30, 2011, respectively.
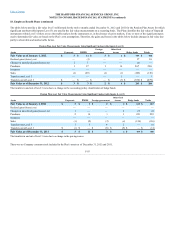
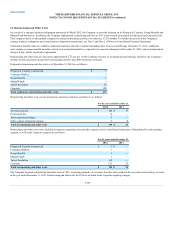
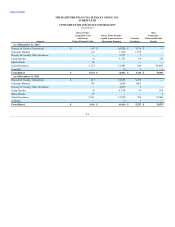
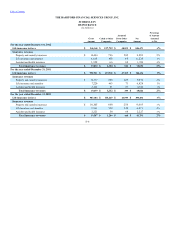
[2] On March 1, 2013, the Company filed Amendment No. 1 on Form 10-Q/A to amend and restate its Quarterly Report on Form 10-Q for the three and
nine months ended September 30, 2012 as originally filed with the Securities and Exchange Commission on November 1, 2012. In this restatement the
Company recognized an estimated pre-tax reinsurance loss on disposition of $533 comprised of impairment of goodwill attributed to the Individual
Life business of $342 and a loss accrual for premium deficiency of $191 in the third quarter of 2012. The estimate is subject to change pending final
determination of net assets sold, transaction costs, and other adjustments . The effect of the restatement is summarized as follows:
Income (loss) from continuing operations, net of tax $403 $(388)$15
Net income (loss) $401 $(388)$13
Net income (loss) available to common shareholders $391 $(388)$ 3
Basic earnings (losses) per common share $0.90 $(0.89)$0.01
Diluted earnings (losses) per common share $0.83 $(0.82)$0.01
F-101