The Hartford 2012 Annual Report Download - page 37
Download and view the complete annual report
Please find page 37 of the 2012 The Hartford annual report below. You can navigate through the pages in the report by either clicking on the pages listed below, or by using the keyword search tool below to find specific information within the annual report.-
 1
1 -
2
-
3
-
4
-
5
-
6
-
7
-
8
-
9
-
10
-
11
-
12
-
13
-
14
-
15
-
16
-
17
-
18
-
19
-
20
-
21
-
22
-
23
-
24
-
25
-
26
-
 27
27 -
 28
28 -
 29
29 -
 30
30 -
 31
31 -
 32
32 -
 33
33 -
 34
34 -
 35
35 -
 36
36 -
 37
37 -
 38
38 -
 39
39 -
 40
40 -
 41
41 -
 42
42 -
 43
43 -
 44
44 -
 45
45 -
 46
46 -
 47
47 -
48
-
49
-
50
-
51
-
52
-
53
-
54
-
55
-
56
-
57
-
58
-
59
-
60
-
61
-
62
-
63
-
64
-
65
-
66
-
67
-
68
-
69
-
70
-
71
-
72
-
73
-
74
-
75
-
76
-
77
-
78
-
79
-
80
-
81
-
82
-
83
-
84
-
85
-
86
-
87
-
88
-
89
-
90
-
91
-
92
-
93
-
94
-
95
-
96
-
97
-
98
-
99
-
100
-
101
-
102
-
103
-
104
-
105
-
106
-
107
-
108
-
109
-
110
-
111
-
112
-
113
-
114
-
115
-
116
-
117
-
118
-
119
-
120
-
121
-
122
-
123
-
124
-
125
-
126
-
127
-
128
-
129
-
130
-
131
-
132
-
133
-
134
-
135
-
136
-
137
-
138
-
139
-
140
-
141
-
142
-
143
-
144
-
145
-
146
-
147
-
148
-
149
-
150
-
151
-
152
-
153
-
154
-
155
-
156
-
157
-
158
-
159
-
160
-
161
-
162
-
163
-
164
-
165
-
166
-
167
-
168
-
169
-
170
-
171
-
172
-
173
-
174
-
175
-
176
-
177
-
178
-
179
-
180
-
181
-
182
-
183
-
184
-
185
-
186
-
187
-
188
-
189
-
190
-
191
-
192
-
193
-
194
-
195
-
196
-
197
-
198
-
199
-
200
-
201
-
202
-
203
-
204
-
205
-
206
-
207
-
208
-
209
-
210
-
211
-
212
-
213
-
214
-
215
-
216
-
217
-
218
-
219
-
220
-
221
-
222
-
223
-
224
-
225
-
226
-
227
-
228
-
229
-
230
-
231
-
232
-
233
-
234
-
235
-
236
-
237
-
238
-
239
-
240
-
241
-
242
-
243
-
244
-
245
-
246
-
247
-
248
-
249
-
250
-
251
-
252
-
253
-
254
-
255
-
256
-
257
-
258
-
259
-
260
-
261
-
262
-
263
-
264
-
265
-
266
-
267
-
268
-
269
-
270
-
271
-
272
-
273
-
274
-
275
-
276
-
277
-
278
-
279
-
280
-
281
-
282
-
283
-
284
-
285
-
286
-
287
-
288
-
289
-
290
-
291
-
292
-
293
-
294
-
295
-
296
-
297
-
298
-
299
-
300
-
301
-
302
-
303
-
304
-
305
-
306
-
307
-
308
-
309
-
310
-
311
-
312
-
313
-
314
-
315
-
316
-
317
-
318
-
319
-
320
-
321
-
322
-
323
-
324
-
325
-
326
-
327
-
328
-
329
-
330
-
331
-
332
-
333
-
334
-
335
 |
 |

Table of Contents
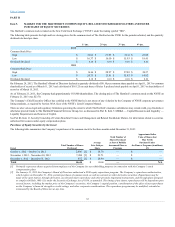
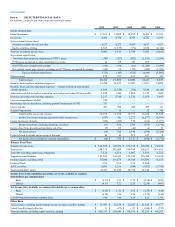
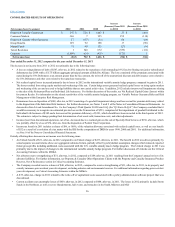
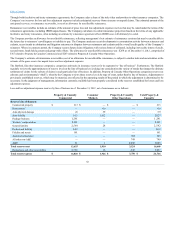
Net income (loss) by segment
Property & Casualty Commercial $ 547 $ 526 $1,007 $ 21 $ (481)
Consumer Markets 166 7125 159 (118)
Property & Casualty Other Operations 57 (117)(53)174 (64)
Group Benefits 129 92 188 37 (96)
Mutual Funds 71 98 132 (27)(34)
Talcott Resolution 1540 672 (539) (132)
Corporate (1,009)(434)(435)(575) 1
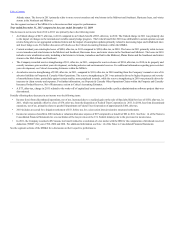
Year ended December 31, 2012 compared to the year ended December 31, 2011
The decrease in net income from 2011 to 2012 was primarily due to the following items:
•A loss on extinguishment of debt of $587, after-tax, in 2012 related to the repurchase of all outstanding 10% fixed-to-floating rate junior subordinated
debentures due 2068 with a $1.75 billion aggregate principal amount all held by Allianz. The loss consisted of the premium associated with
repurchasing the 10% Debentures at an amount greater than the face amount, the write-off of the unamortized discount and debt issuance costs related to
the 10% Debentures and other costs related to the repurchase transaction.
•Net realized capital losses increased primarily due to losses in 2012 on the international variable annuity hedge program, compared to gains in 2011.
The losses resulted from rising equity markets and weakening of the yen. Certain hedge assets generated realized capital losses on rising equity markets
and weakening of the yen and are used to hedge liabilities that are not carried at fair value. In addition, 2012 includes intent-to-sell impairments relating
to the sales of the Retirement Plans and Individual Life businesses. For further discussion of the results, see Net Realized Capital Gains (Losses) within
Investment Results. For information on the related sensitivities of the variable annuity hedging program, see Variable Product Guarantee Risks and Risk
Management within Enterprise Risk Management.
•Reinsurance loss on disposition of $388, after-tax, in 2012 consisting of a goodwill impairment charge and loss accrual for premium deficiency related
to the disposition of the Individual Life business. For further discussion, see Notes 2 and 9 of the Notes to Consolidated Financial Statements. As
discussed in Item 9A and Amendment No. 1 to the Company's Third Quarter 2012 Form 10-Q (the “Q3 Form 10-Q/A”) the Company concluded that it
would be necessary to recognize an estimated pre-tax loss on the Transaction of $533, comprised of the impairment of goodwill attributed to the
Individual Life business of $342 and a loss accrual for premium deficiency of $191, which should have been recorded in the third quarter of 2012.
The estimate is subject to change pending final determination of net assets sold, transaction costs, and other adjustments.
•Income (loss) from discontinued operations, net of tax, decreased due to a realized gain on the sale of Specialty Risk Services of $150, after-tax, which
was partially offset by a loss of $74, after-tax, from the disposition of Federal Trust Corporation.
•Income tax benefit in 2011 includes a release of $86, or 100%, of the valuation allowance associated with realized capital losses, as well as a tax benefit
of $52 as a result of a resolution of a tax matter with the IRS for the computation of DRD for years 1998, 2000 and 2001. For additional information,
see Note 14 of the Notes to Consolidated Financial Statements.
Partially offsetting these decreases in net income were the following items:
•An Unlock benefit of $31, after-tax, in 2012 compared to an Unlock charge of $473, after-tax, in 2011. The benefit in 2012 was driven primarily by
actual separate account returns above our aggregated estimated return, partially offset by policyholder assumption changes which reduced expected
future gross profits including additional costs associated with the U.S. variable annuity macro hedge program. The Unlock charge in 2011 was
primarily due to the impact of changes to the international variable annuity hedge program. For further discussion of Unlocks see the Critical
Accounting Estimates within the MD&A.
•Net asbestos reserve strengthening of $31, after-tax, in 2012, compared to $189, after-tax, in 2011 resulting from the Company's annual review of its
asbestos liabilities. For further information, see Property & Casualty Other Operations Claims with the Property and Casualty Insurance Product
Reserves, Net of Reinsurance section in Critical Accounting Estimates.
•The Company recorded reserve releases of $40, after-tax, in 2012, compared to reserve strengthening of $31, after-tax, in 2011, in its property and
casualty insurance prior accident years development, excluding asbestos and environmental reserves. For additional information regarding prior accident
years development, see Critical Accounting Estimates within the MD&A.
•A $73, after-tax, charge in 2011 related to the write-off of capitalized costs associated with a policy administration software project that was
discontinued.
•Current accident year catastrophe losses of $459, after-tax, in 2012 compared to $484, after-tax, in 2011. The losses in 2012 primarily include Storm
Sandy in the Northeast, as well as severe thunderstorms, hail events, and tornadoes in the South, Midwest and Mid-
36