The Hartford 2012 Annual Report Download - page 116
Download and view the complete annual report
Please find page 116 of the 2012 The Hartford annual report below. You can navigate through the pages in the report by either clicking on the pages listed below, or by using the keyword search tool below to find specific information within the annual report.-
 1
1 -
2
-
3
-
4
-
5
-
6
-
7
-
8
-
9
-
10
-
11
-
12
-
13
-
14
-
15
-
16
-
17
-
18
-
19
-
20
-
21
-
22
-
23
-
24
-
25
-
26
-
27
-
28
-
29
-
30
-
31
-
32
-
33
-
34
-
35
-
36
-
37
-
38
-
39
-
40
-
41
-
42
-
43
-
44
-
45
-
46
-
47
-
48
-
49
-
50
-
51
-
52
-
53
-
54
-
55
-
56
-
57
-
58
-
59
-
60
-
61
-
62
-
63
-
64
-
65
-
66
-
67
-
68
-
69
-
70
-
71
-
72
-
73
-
74
-
75
-
76
-
77
-
78
-
79
-
80
-
81
-
82
-
83
-
84
-
85
-
86
-
87
-
88
-
89
-
90
-
91
-
92
-
93
-
94
-
95
-
96
-
97
-
98
-
99
-
100
-
101
-
102
-
103
-
104
-
105
-
 106
106 -
 107
107 -
 108
108 -
 109
109 -
 110
110 -
 111
111 -
 112
112 -
 113
113 -
 114
114 -
 115
115 -
 116
116 -
 117
117 -
 118
118 -
 119
119 -
 120
120 -
 121
121 -
 122
122 -
 123
123 -
 124
124 -
 125
125 -
 126
126 -
127
-
128
-
129
-
130
-
131
-
132
-
133
-
134
-
135
-
136
-
137
-
138
-
139
-
140
-
141
-
142
-
143
-
144
-
145
-
146
-
147
-
148
-
149
-
150
-
151
-
152
-
153
-
154
-
155
-
156
-
157
-
158
-
159
-
160
-
161
-
162
-
163
-
164
-
165
-
166
-
167
-
168
-
169
-
170
-
171
-
172
-
173
-
174
-
175
-
176
-
177
-
178
-
179
-
180
-
181
-
182
-
183
-
184
-
185
-
186
-
187
-
188
-
189
-
190
-
191
-
192
-
193
-
194
-
195
-
196
-
197
-
198
-
199
-
200
-
201
-
202
-
203
-
204
-
205
-
206
-
207
-
208
-
209
-
210
-
211
-
212
-
213
-
214
-
215
-
216
-
217
-
218
-
219
-
220
-
221
-
222
-
223
-
224
-
225
-
226
-
227
-
228
-
229
-
230
-
231
-
232
-
233
-
234
-
235
-
236
-
237
-
238
-
239
-
240
-
241
-
242
-
243
-
244
-
245
-
246
-
247
-
248
-
249
-
250
-
251
-
252
-
253
-
254
-
255
-
256
-
257
-
258
-
259
-
260
-
261
-
262
-
263
-
264
-
265
-
266
-
267
-
268
-
269
-
270
-
271
-
272
-
273
-
274
-
275
-
276
-
277
-
278
-
279
-
280
-
281
-
282
-
283
-
284
-
285
-
286
-
287
-
288
-
289
-
290
-
291
-
292
-
293
-
294
-
295
-
296
-
297
-
298
-
299
-
300
-
301
-
302
-
303
-
304
-
305
-
306
-
307
-
308
-
309
-
310
-
311
-
312
-
313
-
314
-
315
-
316
-
317
-
318
-
319
-
320
-
321
-
322
-
323
-
324
-
325
-
326
-
327
-
328
-
329
-
330
-
331
-
332
-
333
-
334
-
335
 |
 |

Table of Contents
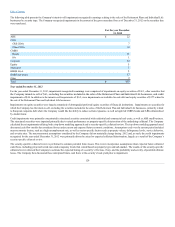
In addition to the credit risk associated with the investment portfolio, the Company has $236 of reinsurance recoverables due from legal entity counterparties
domiciled within Europe. For a more detail discussion of the Company's reinsurance arrangements, see Note 7 of the Notes to the Consolidated Financial
Statements.
Included in the Company’s equity securities, trading, portfolio are investments in World Government Bond Index Funds (“WGBI funds”). The fair value of
the WGBI funds at December 31, 2012 and 2011 was $11.8 billion and $12.5 billion, respectively. Because several of these funds are managed by third
party asset managers, the Company does not have access to detailed holdings; however, the WGBI funds' investment mandate follows the Citigroup non-
Japan World Government Fund Index (“the index”) and includes allocations to certain European sovereign debt. The estimated fair value of the European
allocation based upon the index benchmark allocation was $ 5.0 billion and $5.4 billion as of December 31, 2012 and 2011, respectively. Included in this
estimated European exposure were investments in Ireland, Italy, Portugal and Spain with an estimated fair value of $ 1.6 billion and $1.7 billion as of
December 31, 2012 and 2011, respectively. The index guidelines allow investment in issuers rated BBB- or higher by Standard and Poor's or Baa3 or higher
by Moody's. Should an issuer’s credit rating fall below both of these rating levels they will be removed from the Index and the holdings will be liquidated.
Because these assets support the international variable annuity business, changes in the value of these investments are reflected in the corresponding
policyholder liabilities. The Company’s indirect exposure to these holdings is through any guarantees issued on the underlying variable annuity policies. The
Company has also entered into credit default swaps with a notional amount and fair value of $350 and $28 , respectively, to hedge certain sovereign credit
risks.
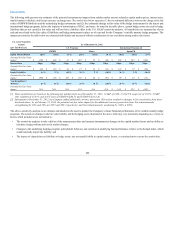
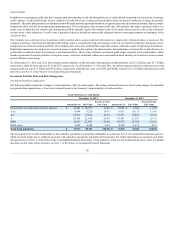
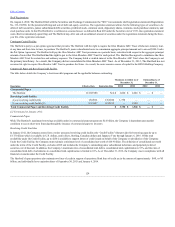
Financial Services
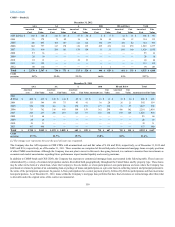
The Company’s exposure to the financial services sector is predominantly through banking and insurance institutions. The following table presents the
Company’s exposure to the financial services sector included in the Securities by Type table above.
AAA $47 $ 49 $ 2 $ 240 $ 245 $ 5
AA 1,039 1,125 86 1,698 1,675 (23)
A3,539 3,763 224 3,664 3,685 21
BBB 2,537 2,563 26 2,335 1,998 (337)
BB & below 399 427 28 305 270 (35)
Domestic financial companies continued to stabilize throughout 2012 due to improved earnings performance, strengthening of asset quality and capital
generation. However, spread volatility remains high due to capital market and economic uncertainty surrounding debt ceiling and sequestration issues, as well
as lingering concerns related to the Eurozone. Financial institutions remain vulnerable to these concerns, as well as ongoing stress in the real estate markets
which could adversely impact the Company’s net unrealized position.
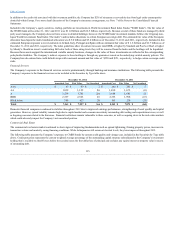
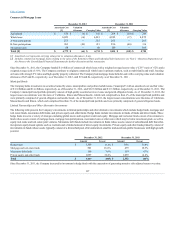
Commercial Real Estate
The commercial real estate market continued to show signs of improving fundamentals such as spread tightening, firming property prices, increases in
transaction volume and modestly easing financing conditions. While delinquencies still remain at elevated levels, they have improved throughout 2012.
The following table presents the Company’s exposure to CMBS bonds by current credit quality and vintage year, included in the Securities by Type table
above. Credit protection represents the current weighted average percentage of the outstanding capital structure subordinated to the Company’s investment
holding that is available to absorb losses before the security incurs the first dollar loss of principal and excludes any equity interest or property value in excess
of outstanding debt.
115