The Hartford 2012 Annual Report Download - page 199
Download and view the complete annual report
Please find page 199 of the 2012 The Hartford annual report below. You can navigate through the pages in the report by either clicking on the pages listed below, or by using the keyword search tool below to find specific information within the annual report.-
 1
1 -
2
-
3
-
4
-
5
-
6
-
7
-
8
-
9
-
10
-
11
-
12
-
13
-
14
-
15
-
16
-
17
-
18
-
19
-
20
-
21
-
22
-
23
-
24
-
25
-
26
-
27
-
28
-
29
-
30
-
31
-
32
-
33
-
34
-
35
-
36
-
37
-
38
-
39
-
40
-
41
-
42
-
43
-
44
-
45
-
46
-
47
-
48
-
49
-
50
-
51
-
52
-
53
-
54
-
55
-
56
-
57
-
58
-
59
-
60
-
61
-
62
-
63
-
64
-
65
-
66
-
67
-
68
-
69
-
70
-
71
-
72
-
73
-
74
-
75
-
76
-
77
-
78
-
79
-
80
-
81
-
82
-
83
-
84
-
85
-
86
-
87
-
88
-
89
-
90
-
91
-
92
-
93
-
94
-
95
-
96
-
97
-
98
-
99
-
100
-
101
-
102
-
103
-
104
-
105
-
106
-
107
-
108
-
109
-
110
-
111
-
112
-
113
-
114
-
115
-
116
-
117
-
118
-
119
-
120
-
121
-
122
-
123
-
124
-
125
-
126
-
127
-
128
-
129
-
130
-
131
-
132
-
133
-
134
-
135
-
136
-
137
-
138
-
139
-
140
-
141
-
142
-
143
-
144
-
145
-
146
-
147
-
148
-
149
-
150
-
151
-
152
-
153
-
154
-
155
-
156
-
157
-
158
-
159
-
160
-
161
-
162
-
163
-
164
-
165
-
166
-
167
-
168
-
169
-
170
-
171
-
172
-
173
-
174
-
175
-
176
-
177
-
178
-
179
-
180
-
181
-
182
-
183
-
184
-
185
-
186
-
187
-
188
-
 189
189 -
 190
190 -
 191
191 -
 192
192 -
 193
193 -
 194
194 -
 195
195 -
 196
196 -
 197
197 -
 198
198 -
 199
199 -
 200
200 -
 201
201 -
 202
202 -
 203
203 -
 204
204 -
 205
205 -
 206
206 -
 207
207 -
 208
208 -
 209
209 -
210
-
211
-
212
-
213
-
214
-
215
-
216
-
217
-
218
-
219
-
220
-
221
-
222
-
223
-
224
-
225
-
226
-
227
-
228
-
229
-
230
-
231
-
232
-
233
-
234
-
235
-
236
-
237
-
238
-
239
-
240
-
241
-
242
-
243
-
244
-
245
-
246
-
247
-
248
-
249
-
250
-
251
-
252
-
253
-
254
-
255
-
256
-
257
-
258
-
259
-
260
-
261
-
262
-
263
-
264
-
265
-
266
-
267
-
268
-
269
-
270
-
271
-
272
-
273
-
274
-
275
-
276
-
277
-
278
-
279
-
280
-
281
-
282
-
283
-
284
-
285
-
286
-
287
-
288
-
289
-
290
-
291
-
292
-
293
-
294
-
295
-
296
-
297
-
298
-
299
-
300
-
301
-
302
-
303
-
304
-
305
-
306
-
307
-
308
-
309
-
310
-
311
-
312
-
313
-
314
-
315
-
316
-
317
-
318
-
319
-
320
-
321
-
322
-
323
-
324
-
325
-
326
-
327
-
328
-
329
-
330
-
331
-
332
-
333
-
334
-
335
 |
 |

Table of Contents
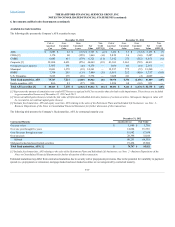
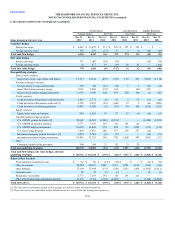
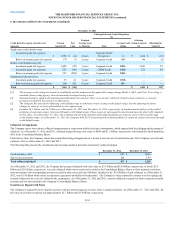
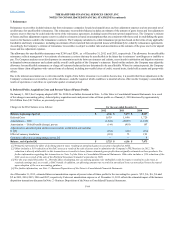
Change in Notional Amount
The net increase in notional amount of derivatives since December 31, 2011, was primarily due to the following:
•$63.1 billion notional amount related to the international program hedging instruments as of December 31, 2012 consisted of $58.5 billion of long
positions and $4.6 billion of offsetting short positions, resulting in a net notional amount of $53.9 billion. The $33.7 billion notional amount as of
December 31, 2011 consisted of $33.0 billion of long positions and $0.7 billion of offsetting short positions, resulting in a net notional amount of $32.3
billion. The increase in net notional of $21.6 billion primarily resulted from the Company increasing its hedging of interest rate exposure.
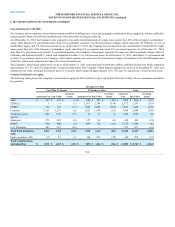
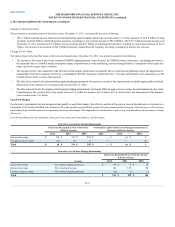
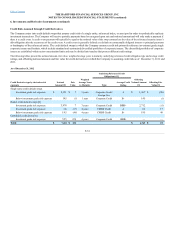
Change in Fair Value
The improvement in the total fair value of derivative instruments since December 31, 2011, was primarily related to the following:
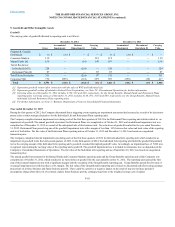
•The increase in fair value related to the combined GMWB hedging program, which includes the GMWB product, reinsurance, and hedging derivatives,
was primarily due to a liability model assumption update, outperformance of the underlying actively managed funds as compared to their respective
indices and lower equity market volatility.
•The increase in fair value related to credit derivatives that assume credit risk was primarily due to credit spread tightening and to the disposition of
substantially all of the Company's interest in a consolidated VIE that contained a credit derivative. For more information on the disposition, see the
Variable Interest Entity section of this footnote.
•The fair value related to the international program hedging instruments decreased as a result of the improvement in global equity markets and the
depreciation of the Japanese yen in relation to the euro and the U.S. dollar.
•The fair value related to the Japanese fixed annuity hedging instruments and Japan 3Win foreign currency swaps decreased primarily due to the
strengthening of the currency basis swap spread between U.S. dollar and Japanese yen, a decline in U.S. interest rates, and depreciation of the Japanese
yen in relation to the U.S. dollar.
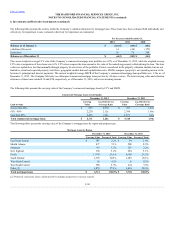
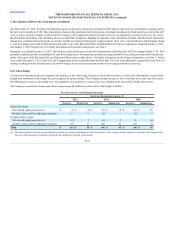
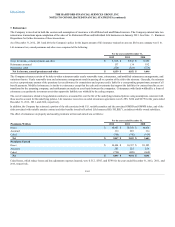
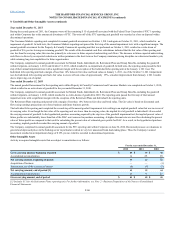
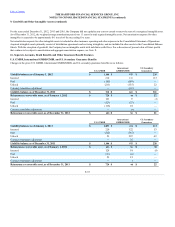
For derivative instruments that are designated and qualify as cash flow hedges, the effective portion of the gain or loss on the derivative is reported as a
component of OCI and reclassified into earnings in the same period or periods durin g which the hedged transaction affects earnings. Gains and losses on the derivative
representing hedge ineffectiveness are recognized in current period earnings. All components of each derivative’s gain or loss were included in the assessment of hedge
effectiveness.
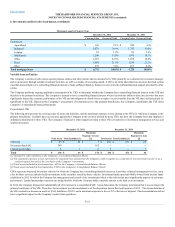
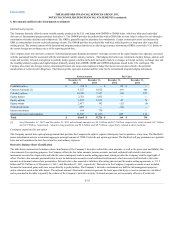
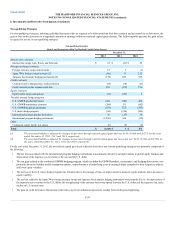
The following table presents the components of the gain or loss on derivatives that qualify as cash flow hedges:
Interest rate swaps $120 $337 $ 294 $ — $ (4) $ 2
Foreign currency swaps (31)(3) 8 — — (1)
Interest rate swaps Net realized capital gain/(loss) $ 90 $ 9 $ 18
Interest rate swaps Net investment income 140 126 94
Foreign currency swaps Net realized capital gain/(loss) (6) (3)(7)
F-57