The Hartford 2012 Annual Report Download - page 145
Download and view the complete annual report
Please find page 145 of the 2012 The Hartford annual report below. You can navigate through the pages in the report by either clicking on the pages listed below, or by using the keyword search tool below to find specific information within the annual report.-
 1
1 -
2
-
3
-
4
-
5
-
6
-
7
-
8
-
9
-
10
-
11
-
12
-
13
-
14
-
15
-
16
-
17
-
18
-
19
-
20
-
21
-
22
-
23
-
24
-
25
-
26
-
27
-
28
-
29
-
30
-
31
-
32
-
33
-
34
-
35
-
36
-
37
-
38
-
39
-
40
-
41
-
42
-
43
-
44
-
45
-
46
-
47
-
48
-
49
-
50
-
51
-
52
-
53
-
54
-
55
-
56
-
57
-
58
-
59
-
60
-
61
-
62
-
63
-
64
-
65
-
66
-
67
-
68
-
69
-
70
-
71
-
72
-
73
-
74
-
75
-
76
-
77
-
78
-
79
-
80
-
81
-
82
-
83
-
84
-
85
-
86
-
87
-
88
-
89
-
90
-
91
-
92
-
93
-
94
-
95
-
96
-
97
-
98
-
99
-
100
-
101
-
102
-
103
-
104
-
105
-
106
-
107
-
108
-
109
-
110
-
111
-
112
-
113
-
114
-
115
-
116
-
117
-
118
-
119
-
120
-
121
-
122
-
123
-
124
-
125
-
126
-
127
-
128
-
129
-
130
-
131
-
132
-
133
-
134
-
 135
135 -
 136
136 -
 137
137 -
 138
138 -
 139
139 -
 140
140 -
 141
141 -
 142
142 -
 143
143 -
 144
144 -
 145
145 -
 146
146 -
 147
147 -
 148
148 -
 149
149 -
 150
150 -
 151
151 -
 152
152 -
 153
153 -
 154
154 -
 155
155 -
156
-
157
-
158
-
159
-
160
-
161
-
162
-
163
-
164
-
165
-
166
-
167
-
168
-
169
-
170
-
171
-
172
-
173
-
174
-
175
-
176
-
177
-
178
-
179
-
180
-
181
-
182
-
183
-
184
-
185
-
186
-
187
-
188
-
189
-
190
-
191
-
192
-
193
-
194
-
195
-
196
-
197
-
198
-
199
-
200
-
201
-
202
-
203
-
204
-
205
-
206
-
207
-
208
-
209
-
210
-
211
-
212
-
213
-
214
-
215
-
216
-
217
-
218
-
219
-
220
-
221
-
222
-
223
-
224
-
225
-
226
-
227
-
228
-
229
-
230
-
231
-
232
-
233
-
234
-
235
-
236
-
237
-
238
-
239
-
240
-
241
-
242
-
243
-
244
-
245
-
246
-
247
-
248
-
249
-
250
-
251
-
252
-
253
-
254
-
255
-
256
-
257
-
258
-
259
-
260
-
261
-
262
-
263
-
264
-
265
-
266
-
267
-
268
-
269
-
270
-
271
-
272
-
273
-
274
-
275
-
276
-
277
-
278
-
279
-
280
-
281
-
282
-
283
-
284
-
285
-
286
-
287
-
288
-
289
-
290
-
291
-
292
-
293
-
294
-
295
-
296
-
297
-
298
-
299
-
300
-
301
-
302
-
303
-
304
-
305
-
306
-
307
-
308
-
309
-
310
-
311
-
312
-
313
-
314
-
315
-
316
-
317
-
318
-
319
-
320
-
321
-
322
-
323
-
324
-
325
-
326
-
327
-
328
-
329
-
330
-
331
-
332
-
333
-
334
-
335
 |
 |

Table of Contents
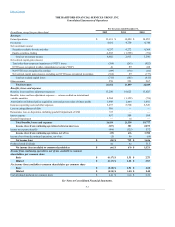
Consolidated Balance Sheets
(In millions, except for share and per share data)
Assets
Investments:
Fixed maturities, available-for-sale, at fair value (amortized cost of $79,747 and $78,978) (includes variable interest entity
assets, at fair value, of $89 and $153) $85,922 $81,809
Fixed maturities, at fair value using the fair value option (includes variable interest entity assets, at fair value, of $163 and
$338) 1,087 1,328
Equity securities, trading, at fair value (cost of $26,820 and $32,928) 28,933 30,499
Equity securities, available-for-sale, at fair value (cost of $866 and $1,056 ) 890 921
Mortgage loans (net of allowances for loan losses of $68 and $102) 6,711 5,728
Policy loans, at outstanding balance 1,997 2,001
Limited partnerships and other alternative investments (includes variable interest entity assets of $6 and $7) 3,015 2,532
Other investments 1,114 2,394
Short-term investments 4,581 7,736
Total investments 134,250 134,948
Cash 2,421 2,581
Premiums receivable and agents’ balances, net 3,542 3,446
Reinsurance recoverables, net 4,666 4,768
Deferred policy acquisition costs and present value of future profits 5,725 6,556
Deferred income taxes, net 1,942 2,131
Goodwill 654 1,006
Property and equipment, net 977 1,029
Other assets 2,767 2,274
Separate account assets 141,569 143,870
Liabilities
Reserve for future policy benefits and unpaid losses and loss adjustment expenses $40,992 $ 41,016
Other policyholder funds and benefits payable 41,979 45,612
Other policyholder funds and benefits payable — international variable annuities 28,922 30,461
Unearned premiums 5,145 5,222
Short-term debt 320 —
Long-term debt 6,806 6,216
Consumer notes 161 314
Other liabilities (includes variable interest entity liabilities of $89 and $471) 10,172 8,412
Separate account liabilities 141,569 143,870
Stockholders’ Equity
Preferred stock, $0.01 par value — 50,000,000 shares authorized, 575,000 shares issued, liquidation preference $1,000 per
share 556 556
Common stock, $0.01 par value — 1,500,000,000 shares authorized, 469,744,822 and 469,750,171 shares issued 5 5
Additional paid-in capital 10,038 10,391
Retained earnings 10,745 11,001
Treasury stock, at cost — 33,439,044 and 27,211,115 shares (1,740) (1,718)
Accumulated other comprehensive income, net of tax 2,843 1,251
See Notes to Consolidated Financial Statements.
F-5