The Hartford 2012 Annual Report Download - page 203
Download and view the complete annual report
Please find page 203 of the 2012 The Hartford annual report below. You can navigate through the pages in the report by either clicking on the pages listed below, or by using the keyword search tool below to find specific information within the annual report.-
 1
1 -
2
-
3
-
4
-
5
-
6
-
7
-
8
-
9
-
10
-
11
-
12
-
13
-
14
-
15
-
16
-
17
-
18
-
19
-
20
-
21
-
22
-
23
-
24
-
25
-
26
-
27
-
28
-
29
-
30
-
31
-
32
-
33
-
34
-
35
-
36
-
37
-
38
-
39
-
40
-
41
-
42
-
43
-
44
-
45
-
46
-
47
-
48
-
49
-
50
-
51
-
52
-
53
-
54
-
55
-
56
-
57
-
58
-
59
-
60
-
61
-
62
-
63
-
64
-
65
-
66
-
67
-
68
-
69
-
70
-
71
-
72
-
73
-
74
-
75
-
76
-
77
-
78
-
79
-
80
-
81
-
82
-
83
-
84
-
85
-
86
-
87
-
88
-
89
-
90
-
91
-
92
-
93
-
94
-
95
-
96
-
97
-
98
-
99
-
100
-
101
-
102
-
103
-
104
-
105
-
106
-
107
-
108
-
109
-
110
-
111
-
112
-
113
-
114
-
115
-
116
-
117
-
118
-
119
-
120
-
121
-
122
-
123
-
124
-
125
-
126
-
127
-
128
-
129
-
130
-
131
-
132
-
133
-
134
-
135
-
136
-
137
-
138
-
139
-
140
-
141
-
142
-
143
-
144
-
145
-
146
-
147
-
148
-
149
-
150
-
151
-
152
-
153
-
154
-
155
-
156
-
157
-
158
-
159
-
160
-
161
-
162
-
163
-
164
-
165
-
166
-
167
-
168
-
169
-
170
-
171
-
172
-
173
-
174
-
175
-
176
-
177
-
178
-
179
-
180
-
181
-
182
-
183
-
184
-
185
-
186
-
187
-
188
-
189
-
190
-
191
-
192
-
 193
193 -
 194
194 -
 195
195 -
 196
196 -
 197
197 -
 198
198 -
 199
199 -
 200
200 -
 201
201 -
 202
202 -
 203
203 -
 204
204 -
 205
205 -
 206
206 -
 207
207 -
 208
208 -
 209
209 -
 210
210 -
 211
211 -
 212
212 -
 213
213 -
214
-
215
-
216
-
217
-
218
-
219
-
220
-
221
-
222
-
223
-
224
-
225
-
226
-
227
-
228
-
229
-
230
-
231
-
232
-
233
-
234
-
235
-
236
-
237
-
238
-
239
-
240
-
241
-
242
-
243
-
244
-
245
-
246
-
247
-
248
-
249
-
250
-
251
-
252
-
253
-
254
-
255
-
256
-
257
-
258
-
259
-
260
-
261
-
262
-
263
-
264
-
265
-
266
-
267
-
268
-
269
-
270
-
271
-
272
-
273
-
274
-
275
-
276
-
277
-
278
-
279
-
280
-
281
-
282
-
283
-
284
-
285
-
286
-
287
-
288
-
289
-
290
-
291
-
292
-
293
-
294
-
295
-
296
-
297
-
298
-
299
-
300
-
301
-
302
-
303
-
304
-
305
-
306
-
307
-
308
-
309
-
310
-
311
-
312
-
313
-
314
-
315
-
316
-
317
-
318
-
319
-
320
-
321
-
322
-
323
-
324
-
325
-
326
-
327
-
328
-
329
-
330
-
331
-
332
-
333
-
334
-
335
 |
 |

Table of Contents
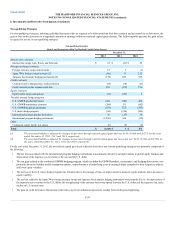
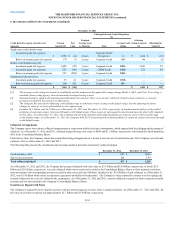
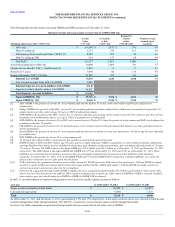
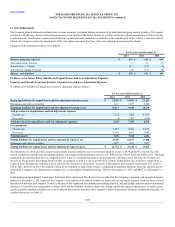
The Company enters into credit default swaps that assume credit risk of a single entity, referenced index, or asset pool in order to synthetically replicate
investment transactions. The Company will receive periodic payments based on an agreed upon rate and notional amount and will only make a payment if
there is a credit event. A credit event payment will typically be equal to the notional value of the swap contract less the value of the referenced security issuer’s
debt obligation after the occurrence of the credit event. A credit event is generally defined as a default on contractually obligated interest or principal payments
or bankruptcy of the referenced entity. The credit default swaps in which the Company assumes credit risk primarily reference investment grade single
corporate issuers and baskets, which include standard and customized diversified portfolios of corporate issuers. The diversified portfolios of corporate
issuers are established within sector concentration limits and may be divided into tranches that possess different credit ratings.
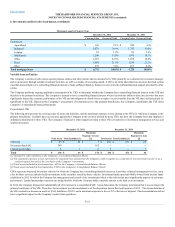
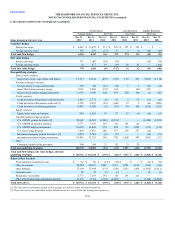
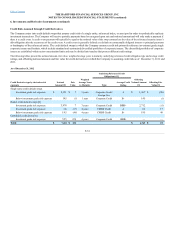
The following tables present the notional amount, fair value, weighted average years to maturity, underlying referenced credit obligation type and average credit
ratings, and offsetting notional amounts and fair value for credit derivatives in which the Company is assuming credit risk as of December 31, 2012 and
2011.
Single name credit default swaps
Investment grade risk exposure $ 2,321 $ 7 3 years Corporate Credit/
Foreign Gov.
A$1,367 $ (26)
Below investment grade risk exposure 145 (1)1 year Corporate Credit B+ 145 (3)
Basket credit default swaps [4]
Investment grade risk exposure 3,978 73 years Corporate Credit BBB+ 2,712 (13)
Investment grade risk exposure 330 (17)4 years CMBS Credit A330 17
Below investment grade risk exposure 195 (46)4 years CMBS Credit B+ 195 46
Embedded credit derivatives
Investment grade risk exposure 525 478 4 years Corporate Credit BBB- — —
F-61