The Hartford 2012 Annual Report Download - page 191
Download and view the complete annual report
Please find page 191 of the 2012 The Hartford annual report below. You can navigate through the pages in the report by either clicking on the pages listed below, or by using the keyword search tool below to find specific information within the annual report.-
 1
1 -
2
-
3
-
4
-
5
-
6
-
7
-
8
-
9
-
10
-
11
-
12
-
13
-
14
-
15
-
16
-
17
-
18
-
19
-
20
-
21
-
22
-
23
-
24
-
25
-
26
-
27
-
28
-
29
-
30
-
31
-
32
-
33
-
34
-
35
-
36
-
37
-
38
-
39
-
40
-
41
-
42
-
43
-
44
-
45
-
46
-
47
-
48
-
49
-
50
-
51
-
52
-
53
-
54
-
55
-
56
-
57
-
58
-
59
-
60
-
61
-
62
-
63
-
64
-
65
-
66
-
67
-
68
-
69
-
70
-
71
-
72
-
73
-
74
-
75
-
76
-
77
-
78
-
79
-
80
-
81
-
82
-
83
-
84
-
85
-
86
-
87
-
88
-
89
-
90
-
91
-
92
-
93
-
94
-
95
-
96
-
97
-
98
-
99
-
100
-
101
-
102
-
103
-
104
-
105
-
106
-
107
-
108
-
109
-
110
-
111
-
112
-
113
-
114
-
115
-
116
-
117
-
118
-
119
-
120
-
121
-
122
-
123
-
124
-
125
-
126
-
127
-
128
-
129
-
130
-
131
-
132
-
133
-
134
-
135
-
136
-
137
-
138
-
139
-
140
-
141
-
142
-
143
-
144
-
145
-
146
-
147
-
148
-
149
-
150
-
151
-
152
-
153
-
154
-
155
-
156
-
157
-
158
-
159
-
160
-
161
-
162
-
163
-
164
-
165
-
166
-
167
-
168
-
169
-
170
-
171
-
172
-
173
-
174
-
175
-
176
-
177
-
178
-
179
-
180
-
 181
181 -
 182
182 -
 183
183 -
 184
184 -
 185
185 -
 186
186 -
 187
187 -
 188
188 -
 189
189 -
 190
190 -
 191
191 -
 192
192 -
 193
193 -
 194
194 -
 195
195 -
 196
196 -
 197
197 -
 198
198 -
 199
199 -
 200
200 -
 201
201 -
202
-
203
-
204
-
205
-
206
-
207
-
208
-
209
-
210
-
211
-
212
-
213
-
214
-
215
-
216
-
217
-
218
-
219
-
220
-
221
-
222
-
223
-
224
-
225
-
226
-
227
-
228
-
229
-
230
-
231
-
232
-
233
-
234
-
235
-
236
-
237
-
238
-
239
-
240
-
241
-
242
-
243
-
244
-
245
-
246
-
247
-
248
-
249
-
250
-
251
-
252
-
253
-
254
-
255
-
256
-
257
-
258
-
259
-
260
-
261
-
262
-
263
-
264
-
265
-
266
-
267
-
268
-
269
-
270
-
271
-
272
-
273
-
274
-
275
-
276
-
277
-
278
-
279
-
280
-
281
-
282
-
283
-
284
-
285
-
286
-
287
-
288
-
289
-
290
-
291
-
292
-
293
-
294
-
295
-
296
-
297
-
298
-
299
-
300
-
301
-
302
-
303
-
304
-
305
-
306
-
307
-
308
-
309
-
310
-
311
-
312
-
313
-
314
-
315
-
316
-
317
-
318
-
319
-
320
-
321
-
322
-
323
-
324
-
325
-
326
-
327
-
328
-
329
-
330
-
331
-
332
-
333
-
334
-
335
 |
 |

Table of Contents
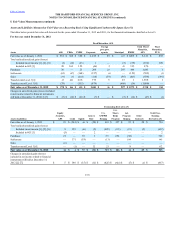
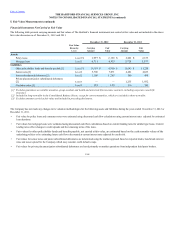
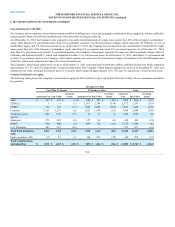
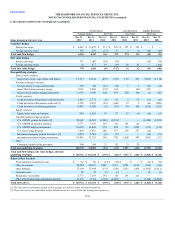
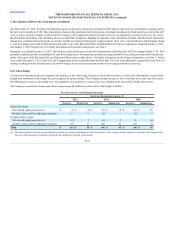
ABS $629 $594 $(35) $ 1,169 $ 872 $ (297) $ 1,798 $1,466 $(332)
CDOs [1] 81 59 (22)2,709 2,383 (326)2,790 2,442 (348)
CMBS 1,297 1,194 (103)2,144 1,735 (409)3,441 2,929 (512)
Corporate 4,388 4,219 (169)3,268 2,627 (570)7,656 6,846 (739)
Foreign govt./govt.
agencies
218 212 (6) 51 47 (4)269 259 (10)
Municipal 299 294 (5) 627 560 (67) 926 854 (72)
RMBS 415 330 (85) 1,206 835 (371)1,621 1,165 (456)
U.S. Treasuries 343 341 (2) — — — 343 341 (2)
Equity securities, AFS 167 138 (29) 439 265 (174)606 403 (203)
[1] Unrealized losses exclude the change in fair value of bifurcated embedded derivative features of certain securities. Subsequent changes in fair value are
recorded in net realized capital gains (losses).
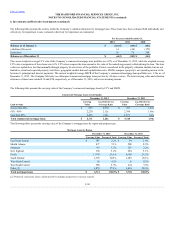
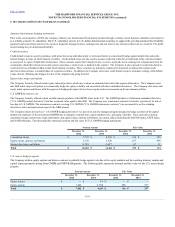
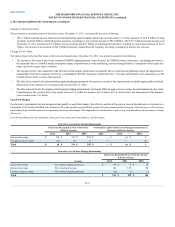
As of December 31, 2012, AFS securities in an unrealized loss position, comprised of 2,011 securities, primarily related to corporate securities within the
financial services sector, ABS, CMBS, CDOs, and RMBS which have experienced price deterioration. As of December 31, 2012, 86% of these securities
were depressed less than 20% of cost or amortized cost. The decline in the total unrealized loss of $1.6 billion in 2012 was primarily attributable to credit
spread tightening and a decline in interest rates.
Most of the securities depressed for twelve months or more relate to structured securities with exposure to commercial and residential real estate, ABS backed
by student loans, as well as certain floating rate corporate securities or those securities with greater than 10 years to maturity, concentrated in the financial
services sector. Current market spreads continue to be significantly wider for structured securities with exposure to commercial and residential real estate, as
compared to spreads at the security’s respective purchase date, largely due to the economic and market uncertainties regarding future performance of
commercial and residential real estate. In addition, the majority of securities have a floating-rate coupon referenced to a market index where rates have declined
substantially. In addition equity securities include investment grade perpetual preferred securities that contain "debt-like" characteristics where the decline in
fair value is not attributable to issuer-specific credit deterioration, none of which have, nor are expected to, miss a periodic dividend payment. These securities
have been depressed due to the securities' floating-rate coupon in the current low interest rate environment, general market credit spread widening since the date
of purchase and the long-dated nature of the securities. The Company neither has an intention to sell nor does it expect to be required to sell the securities
outlined above.
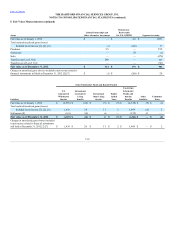
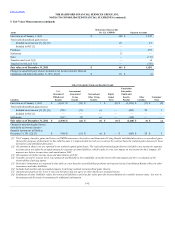
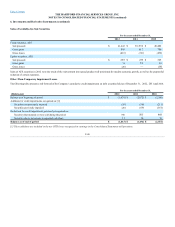
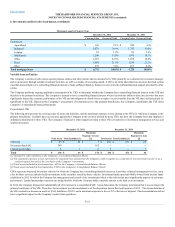
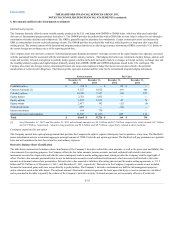
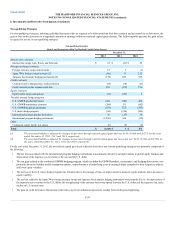
Commercial $6,779 $ (68) $ 6,711 $ 5,830 $ (102) $ 5,728
[1] Amortized cost represents carrying value prior to valuation allowances, if any.
[2] Includes commercial mortgage loans relating to the sales of the Retirement Plans and Individual Life businesses; see Note 2 - Business Dispositions of
the Notes to Consolidated Financial Statements for further discussion of this transaction.
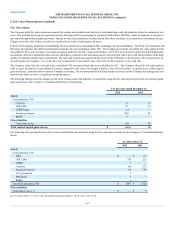
As of December 31, 2012 and 2011, the carrying value of mortgage loans associated with the valuation allowance was $291 and $621, respectively. Included
in the table above are mortgage loans held-for-sale with a carrying value and valuation allowance of $47 and $3, respectively, as of December 31, 2012, and
$74 and $4, respectively, as of December 31, 2011. The carrying value of these loans is included in mortgage loans in the Company’s Consolidated Balance
Sheets. As of December 31, 2012, loans within the Company’s mortgage loan portfolio that have had extensions or restructurings other than what is allowable
under the original terms of the contract are immaterial.
F-49