The Hartford 2012 Annual Report Download - page 218
Download and view the complete annual report
Please find page 218 of the 2012 The Hartford annual report below. You can navigate through the pages in the report by either clicking on the pages listed below, or by using the keyword search tool below to find specific information within the annual report.-
 1
1 -
2
-
3
-
4
-
5
-
6
-
7
-
8
-
9
-
10
-
11
-
12
-
13
-
14
-
15
-
16
-
17
-
18
-
19
-
20
-
21
-
22
-
23
-
24
-
25
-
26
-
27
-
28
-
29
-
30
-
31
-
32
-
33
-
34
-
35
-
36
-
37
-
38
-
39
-
40
-
41
-
42
-
43
-
44
-
45
-
46
-
47
-
48
-
49
-
50
-
51
-
52
-
53
-
54
-
55
-
56
-
57
-
58
-
59
-
60
-
61
-
62
-
63
-
64
-
65
-
66
-
67
-
68
-
69
-
70
-
71
-
72
-
73
-
74
-
75
-
76
-
77
-
78
-
79
-
80
-
81
-
82
-
83
-
84
-
85
-
86
-
87
-
88
-
89
-
90
-
91
-
92
-
93
-
94
-
95
-
96
-
97
-
98
-
99
-
100
-
101
-
102
-
103
-
104
-
105
-
106
-
107
-
108
-
109
-
110
-
111
-
112
-
113
-
114
-
115
-
116
-
117
-
118
-
119
-
120
-
121
-
122
-
123
-
124
-
125
-
126
-
127
-
128
-
129
-
130
-
131
-
132
-
133
-
134
-
135
-
136
-
137
-
138
-
139
-
140
-
141
-
142
-
143
-
144
-
145
-
146
-
147
-
148
-
149
-
150
-
151
-
152
-
153
-
154
-
155
-
156
-
157
-
158
-
159
-
160
-
161
-
162
-
163
-
164
-
165
-
166
-
167
-
168
-
169
-
170
-
171
-
172
-
173
-
174
-
175
-
176
-
177
-
178
-
179
-
180
-
181
-
182
-
183
-
184
-
185
-
186
-
187
-
188
-
189
-
190
-
191
-
192
-
193
-
194
-
195
-
196
-
197
-
198
-
199
-
200
-
201
-
202
-
203
-
204
-
205
-
206
-
207
-
 208
208 -
 209
209 -
 210
210 -
 211
211 -
 212
212 -
 213
213 -
 214
214 -
 215
215 -
 216
216 -
 217
217 -
 218
218 -
 219
219 -
 220
220 -
 221
221 -
 222
222 -
 223
223 -
 224
224 -
 225
225 -
 226
226 -
 227
227 -
 228
228 -
229
-
230
-
231
-
232
-
233
-
234
-
235
-
236
-
237
-
238
-
239
-
240
-
241
-
242
-
243
-
244
-
245
-
246
-
247
-
248
-
249
-
250
-
251
-
252
-
253
-
254
-
255
-
256
-
257
-
258
-
259
-
260
-
261
-
262
-
263
-
264
-
265
-
266
-
267
-
268
-
269
-
270
-
271
-
272
-
273
-
274
-
275
-
276
-
277
-
278
-
279
-
280
-
281
-
282
-
283
-
284
-
285
-
286
-
287
-
288
-
289
-
290
-
291
-
292
-
293
-
294
-
295
-
296
-
297
-
298
-
299
-
300
-
301
-
302
-
303
-
304
-
305
-
306
-
307
-
308
-
309
-
310
-
311
-
312
-
313
-
314
-
315
-
316
-
317
-
318
-
319
-
320
-
321
-
322
-
323
-
324
-
325
-
326
-
327
-
328
-
329
-
330
-
331
-
332
-
333
-
334
-
335
 |
 |

Table of Contents
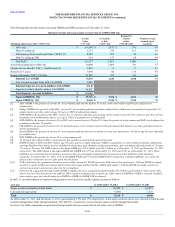
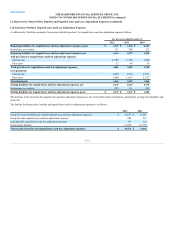
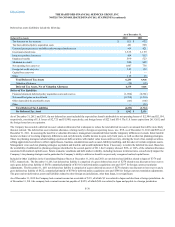
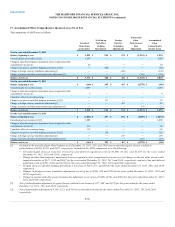
Deferred tax assets (liabilities) include the following:
Tax discount on loss reserves $621 $ 632
Tax basis deferred policy acquisition costs 481 528
Unearned premium reserve and other underwriting related reserves 414 421
Investment-related items 1,525 1,159
Insurance product derivatives 454 913
Employee benefits 599 523
Minimum tax credit 860 868
Net operating loss carryover 1,007 736
Foreign tax credit carryover 149 132
Capital loss carryover 5 —
Other 118 16
Valuation Allowance (58) (83)
Financial statement deferred policy acquisition costs and reserves (1,694) (2,361)
Net unrealized gains on investments (2,396)(1,210)
Other depreciable & amortizable assets (143)(104)
Other —(39)
As of December 31, 2012 and 2011, the net deferred tax asset included the expected tax benefit attributable to net operating losses of $2,946 and $2,194,
respectively, consisting of U.S. losses of $2,725 and $1,880, respectively, and foreign losses of $221 and $314. The U.S. losses expire from 2013-2032 and
the foreign losses have no expiration.
The Company has recorded a deferred tax asset valuation allowance that is adequate to reduce the total deferred tax asset to an amount that will be more likely
than not realized. The deferred tax asset valuation allowance, relating mostly to foreign net operating losses, was $58, as of December 31, 2012 and $83 as of
December 31, 2011. In assessing the need for a valuation allowance, management considered future taxable temporary difference reversals, future taxable
income exclusive of reversing temporary differences and carryforwards, taxable income in open carry back years, as well as other tax planning strategies.
These tax planning strategies include holding a portion of debt securities with market value losses until recovery, altering the level of tax exempt securities,
selling appreciated securities to offset capital losses, business considerations such as asset-liability matching, and the sales of certain corporate assets.
Management views such tax planning strategies as prudent and feasible, and would implement them, if necessary, to realize the deferred tax asset. Based on
the availability of additional tax planning strategies identified in the second quarter of 2011, the Company released $86, or 100% of the valuation allowance
associated with realized capital losses. Future economic conditions and debt market volatility, including increases in interest rates, can adversely impact the
Company’s tax planning strategies and in particular the Company’s ability to utilize tax benefits on previously recognized realized capital losses.
Included in Other Liabilities in the Consolidated Balance Sheets at December 31, 2012 and 2011 are net deferred tax liabilities related to Japan of $376 and
$352, respectively. The December 31, 2012 net deferred tax liability is comprised of a gross deferred tax asset of $274 related to tax discount on loss reserves
and a gross deferred tax liability of $650, comprised primarily of $331 for deferred policy acquisition costs and $197 for foreign currency translation
adjustments. The December 31, 2011 net deferred tax liability is comprised of a gross deferred tax asset of $270 related to tax discount on loss reserves and a
gross deferred tax liability of $622, comprised primarily of $370 for deferred policy acquisition costs and $346 for foreign currency translation adjustments.
The gross and net deferred tax assets and liabilities related to other foreign tax jurisdictions, other than Japan, is not significant.
As of December 31, 2012 the Company had a current income tax receivable of $19, of which $1 was related to Japan and due from a foreign jurisdiction. As
of December 31, 2011 the company had a current income tax payable of $459, of which $46 was related to Japan and payable to a foreign jurisdiction.
F-76