The Hartford 2012 Annual Report Download - page 211
Download and view the complete annual report
Please find page 211 of the 2012 The Hartford annual report below. You can navigate through the pages in the report by either clicking on the pages listed below, or by using the keyword search tool below to find specific information within the annual report.-
 1
1 -
2
-
3
-
4
-
5
-
6
-
7
-
8
-
9
-
10
-
11
-
12
-
13
-
14
-
15
-
16
-
17
-
18
-
19
-
20
-
21
-
22
-
23
-
24
-
25
-
26
-
27
-
28
-
29
-
30
-
31
-
32
-
33
-
34
-
35
-
36
-
37
-
38
-
39
-
40
-
41
-
42
-
43
-
44
-
45
-
46
-
47
-
48
-
49
-
50
-
51
-
52
-
53
-
54
-
55
-
56
-
57
-
58
-
59
-
60
-
61
-
62
-
63
-
64
-
65
-
66
-
67
-
68
-
69
-
70
-
71
-
72
-
73
-
74
-
75
-
76
-
77
-
78
-
79
-
80
-
81
-
82
-
83
-
84
-
85
-
86
-
87
-
88
-
89
-
90
-
91
-
92
-
93
-
94
-
95
-
96
-
97
-
98
-
99
-
100
-
101
-
102
-
103
-
104
-
105
-
106
-
107
-
108
-
109
-
110
-
111
-
112
-
113
-
114
-
115
-
116
-
117
-
118
-
119
-
120
-
121
-
122
-
123
-
124
-
125
-
126
-
127
-
128
-
129
-
130
-
131
-
132
-
133
-
134
-
135
-
136
-
137
-
138
-
139
-
140
-
141
-
142
-
143
-
144
-
145
-
146
-
147
-
148
-
149
-
150
-
151
-
152
-
153
-
154
-
155
-
156
-
157
-
158
-
159
-
160
-
161
-
162
-
163
-
164
-
165
-
166
-
167
-
168
-
169
-
170
-
171
-
172
-
173
-
174
-
175
-
176
-
177
-
178
-
179
-
180
-
181
-
182
-
183
-
184
-
185
-
186
-
187
-
188
-
189
-
190
-
191
-
192
-
193
-
194
-
195
-
196
-
197
-
198
-
199
-
200
-
 201
201 -
 202
202 -
 203
203 -
 204
204 -
 205
205 -
 206
206 -
 207
207 -
 208
208 -
 209
209 -
 210
210 -
 211
211 -
 212
212 -
 213
213 -
 214
214 -
 215
215 -
 216
216 -
 217
217 -
 218
218 -
 219
219 -
 220
220 -
 221
221 -
222
-
223
-
224
-
225
-
226
-
227
-
228
-
229
-
230
-
231
-
232
-
233
-
234
-
235
-
236
-
237
-
238
-
239
-
240
-
241
-
242
-
243
-
244
-
245
-
246
-
247
-
248
-
249
-
250
-
251
-
252
-
253
-
254
-
255
-
256
-
257
-
258
-
259
-
260
-
261
-
262
-
263
-
264
-
265
-
266
-
267
-
268
-
269
-
270
-
271
-
272
-
273
-
274
-
275
-
276
-
277
-
278
-
279
-
280
-
281
-
282
-
283
-
284
-
285
-
286
-
287
-
288
-
289
-
290
-
291
-
292
-
293
-
294
-
295
-
296
-
297
-
298
-
299
-
300
-
301
-
302
-
303
-
304
-
305
-
306
-
307
-
308
-
309
-
310
-
311
-
312
-
313
-
314
-
315
-
316
-
317
-
318
-
319
-
320
-
321
-
322
-
323
-
324
-
325
-
326
-
327
-
328
-
329
-
330
-
331
-
332
-
333
-
334
-
335
 |
 |

Table of Contents
The Company offered enhanced crediting rates or bonus payments to contract holders on certain of its individual and group annuity products. The expense
associated with offering a bonus is deferred and amortized over the life of the related contract in a pattern consistent with the amortization of deferred policy
acquisition costs. Amortization expense associated with expenses previously deferred is recorded over the remaining life of the contract. Consistent with the
Unlock, the Company unlocks the amortization of the sales inducement asset. See Note 8 for more information concerning the Unlock.
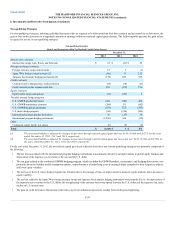
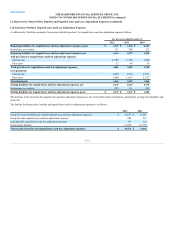
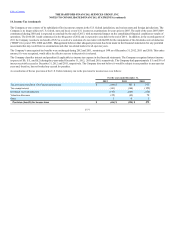
Changes in sales inducement activity are as follows:
Sales inducements deferred 720 31
Amortization — Unlock (82)(28)(2)
Amortization charged to income (34)(17)(8)
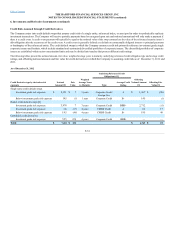
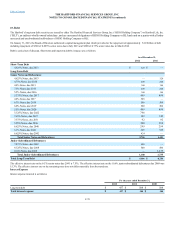
A rollforward of liabilities for unpaid losses and loss adjustment expenses follows:
Reinsurance and other recoverables 3,033 3,077 3,441
Current year 7,274 7,420 6,768
Prior years (4) 367 (196)
Current year 2,882 3,181 2,952
Prior years 4,216 4,037 3,882
Reinsurance and other recoverables 3,027 3,033 3,077
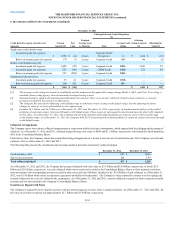
As of December 31, 2012 and 2011, property and casualty insurance products reserves were discounted by a total of $538 and $542, respectively. The
current accident year benefit from discounting property and casualty insurance products reserves was $48 in 2012, $58 in 2011 and $46 in 2010. The slight
reduction in discount benefit in 2012 as compared to 2011 is due to a continued reduction in the discount rate, reflecting a lower risk-free rate of return over
this period. The growth in discounting benefit in 2011 as compared to 2010 was due to growth in the workers' compensation line of business, tempered by a
reduction in the discount rate, reflecting a lower risk-free rate of return over this period. Accretion of discounts for prior accident years totaled $52 in 2012,
$38 in 2011, and $26 in 2010. For annuities issued by the Company to fund certain workers’ compensation indemnity payments where the claimant has not
released the Company of its obligation, the Company has recorded annuity obligations totaling $834 as of December 31, 2012 and $867 as of December 31,
2011.
In the opinion of management, based upon the known facts and current law, the reserves recorded for the Company’s property and casualty insurance
products at December 31, 2012 represent the Company’s best estimate of its ultimate liability for losses and loss adjustment expenses related to losses covered
by policies written by the Company. However, because of the significant uncertainties surrounding reserves, and particularly asbestos and environmental
exposures, it is possible that management’s estimate of the ultimate liabilities for these claims may change and that the required adjustment to recorded reserves
could exceed the currently recorded reserves by an amount that could be material to the Company’s results of operations, financial condition and liquidity. For
a further discussion, see Note 13.
F-69